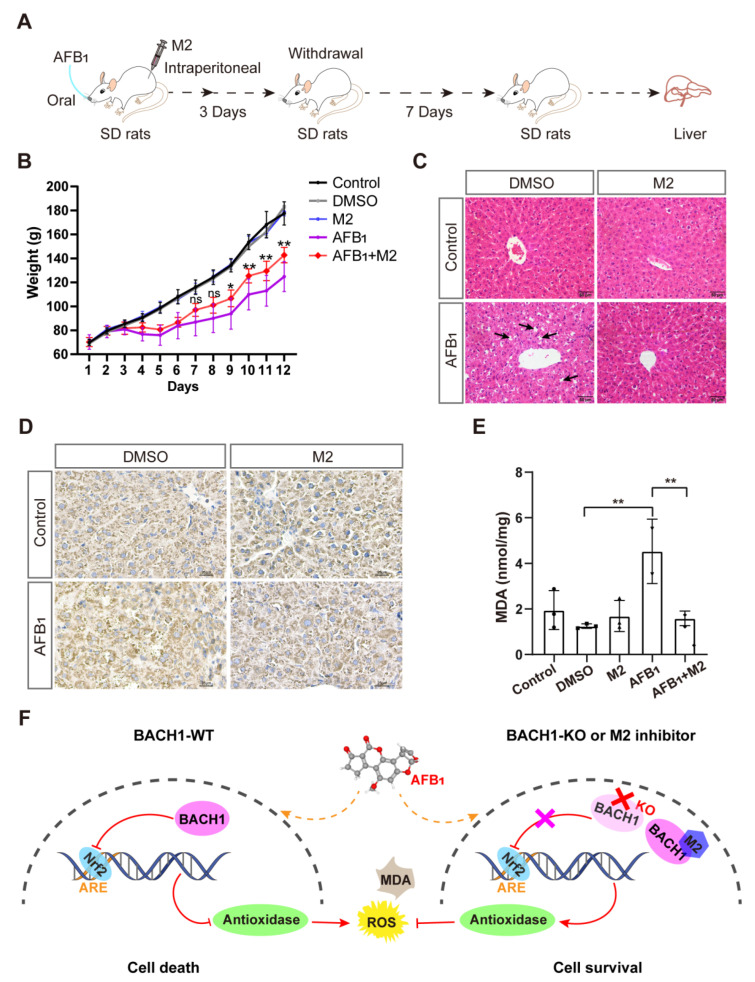
Figure 5.
Liver damage from aflatoxin B1 is significantly lower in M2-treated rats. (A) Schematic of M2 treatment of AFB1-induced SD rats. (B) Body weights of SD rats during AFB1 exposure with and without M2 treatment. (C) Liver histopathology of AFB1-exposed rats and control group. The specific inflammatory cell infiltration is indicated with an arrow. Scale bar, 50 μm. (D) Representative light microscopy images of immunohistochemical staining for AFB1-DNA adducts in liver tissues with and without M2 treatment. Scale bar, 25 μm. (E) MDA levels in liver tissues with and without M2 treatment. (F) Proposed molecular model of BACH1 and M2 in AFB1-exposed cells. * p < 0.05, ** p < 0.01, ns, not significant. p values were determined with two-tailed Students’ t-tests. ROS, reactive oxygen species; MDA, malondialdehyde; AFB1, aflatoxin B1; WT, wild-type; KO, knockout; DMSO, dimethyl sulfoxide; DMSO used as a negative control; Nrf2, NF-E2-related factor 2; ARE, antioxidant response element; M2, 1-Piperazineethanol,α-[(1,3-benzodioxol-5-yloxy)methyl]-4-(2-methoxyphenyl); SD rats, Sprague-Dawley (SD) rats.

