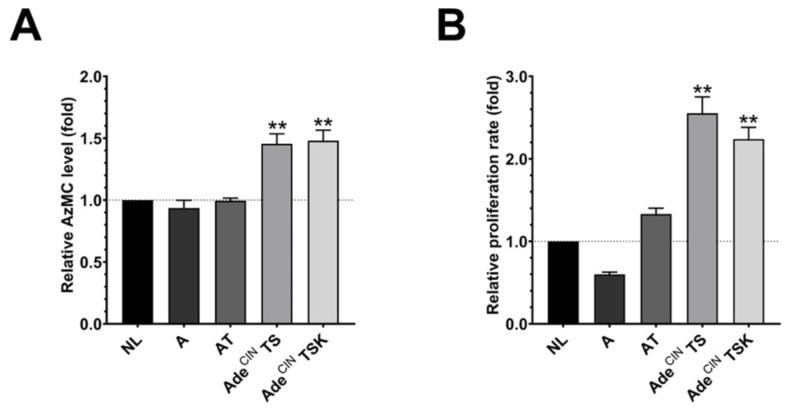
Figure 2.
Increased H2S production and increased cell proliferation in AdeCIN TS and AdeCIN TSK organoids. (A) AzMC-aided live cell imaging quantification of NL, A, AT, AdeCIN TS and AdeCIN TSK organoids after 7 days in culture. (B) Cell proliferation rate of NL, A, AT, AdeCIN TS and AdeCIN TSK organoids after 7 days in culture. Data represent mean ± SEM of at least 4 independent experiments. ** p < 0.01 compared to control.

