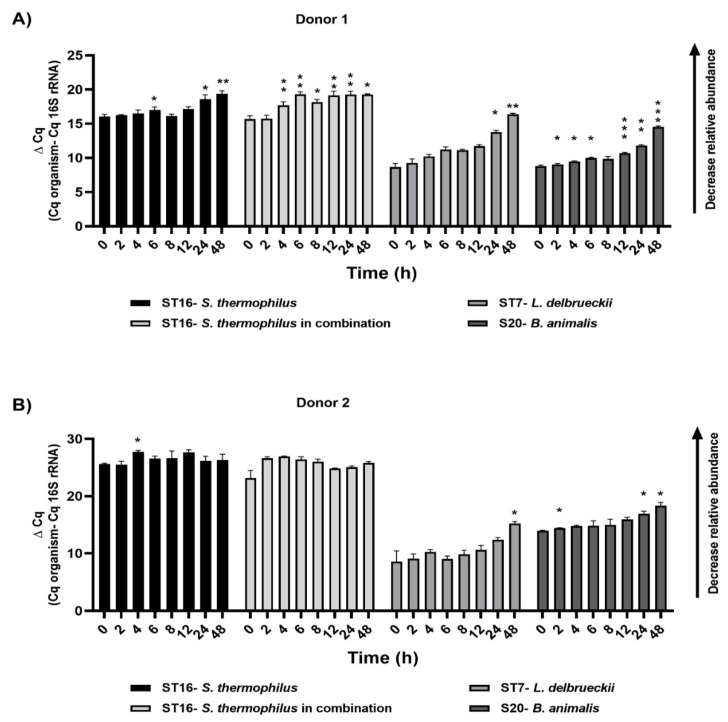
Figure 6.
Relative abundance of target species identified by qPCR, as indicated by ΔCq: relative abundance of inoculated probiotic candidates in various bioreactors with donor 1 (A) and donor 2 (B) microbiota over 48 h post treatment. The increase in ΔCq indicates a decrease in the relative abundance. Repeated measures ANOVA with Dunnett’s multiple comparisons test was used for statistics. Significant differences were indicated for each time point compared to the zero time (* p < 0.05, ** p < 0.01, *** p < 0.001).

