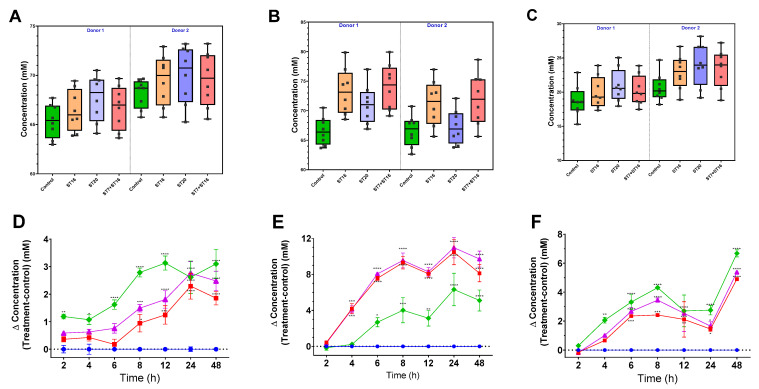
Figure 7.
Concentration (panels (A–C); separated by donor) and concentration fold increase over control (panels (D–F); combined datasets) (Δ concentration = test-treatment−control) of short-chain fatty acids (SCFAs) measured by GC over 48 h: butyrate (A,D), acetate (B,E), and propionate (C,F) from top to bottom for each time point, with two biological replicates for donors 1 and 2 (A–C) over 48 h. Control (circle, blue); treatment with ST20 (diamond, green); treatment with ST16 (square, red); and treatment ST16 in combination with ST7 (triangle, purple). Statistical comparisons were conducted using repeated measures 2-way ANOVA test with Dunnett’s multiple comparisons test. Significant differences were indicated for each time point compared to the control time (* p < 0.05, ** p < 0.01, *** p < 0.001, **** p < 0.0001).

