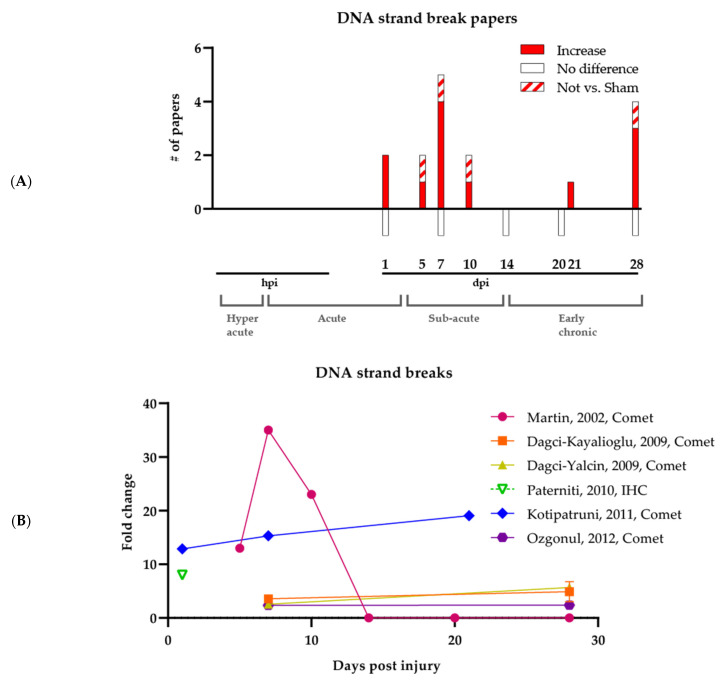
Figure 2.
Increase of DNA strand breaks following SCI. (A) Summary of all published papers on DNA strand breaks following SCI. The bars underneath the graph represent papers reporting no difference between SCI and Sham groups. The brackets at the bottom of the figure show the different SCI phases. (B) Plot of all quantified data involving DNA strand break measurements, showing the timing and magnitude of differences in DNA strand breaks between SCI and Sham groups. Calculated fold change of SCI versus Sham per time point is visualized. hpi, hours post-injury; dpi, days post-injury.

