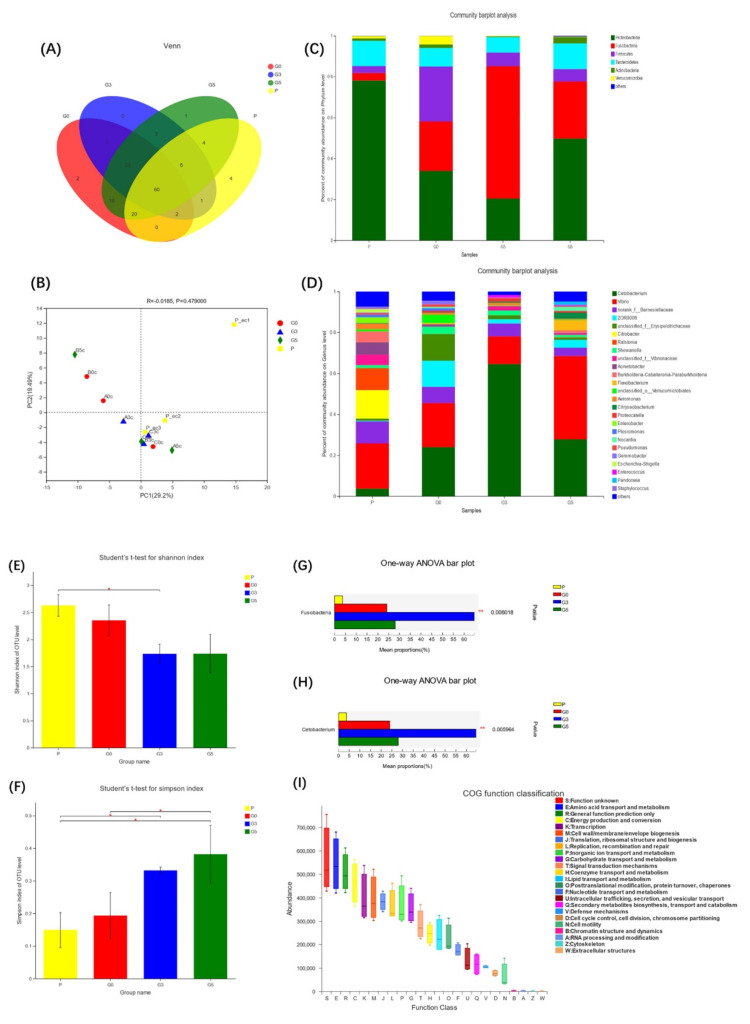
Figure 6.
Intestinal microbiota changes after Aeromonas hydrophila infection between all groups. (A): OTU overlap analysis; (B): PCA at the OTU level; (C,D): community differences at the phylum and genus levels; (E): index of Shannon; (F): index of Simpson; (G,H): significant difference at the phylum and genus levels; and (I): relative abundance of COG functions. n = 3 per group. * p < 0.05, ** p < 0.01.

