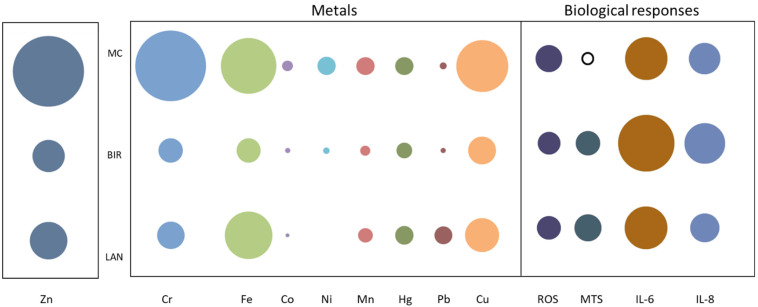
Figure 6.
Summary of biological responses and heavy metal concentrations of UF-RDPs from Lancaster, Birmingham, and Mexico City in Calu-3 cells. The bubble plot depicts the relative abundance of selected metals (ppm) in UF-RDPs from Mexico City (MC), Birmingham (BIR), and Lancaster (LAN). The concentration of Zn is ~10-fold greater than the other metals so has been scaled separately. The biological responses to 75 µg/mL UF-RDPs are represented as percentages of the untreated control, measured at 24 h (MTS, IL-6, and IL-8) or 4 h (ROS). Solid black outline indicates a decrease, whilst filled circles indicate increases.

