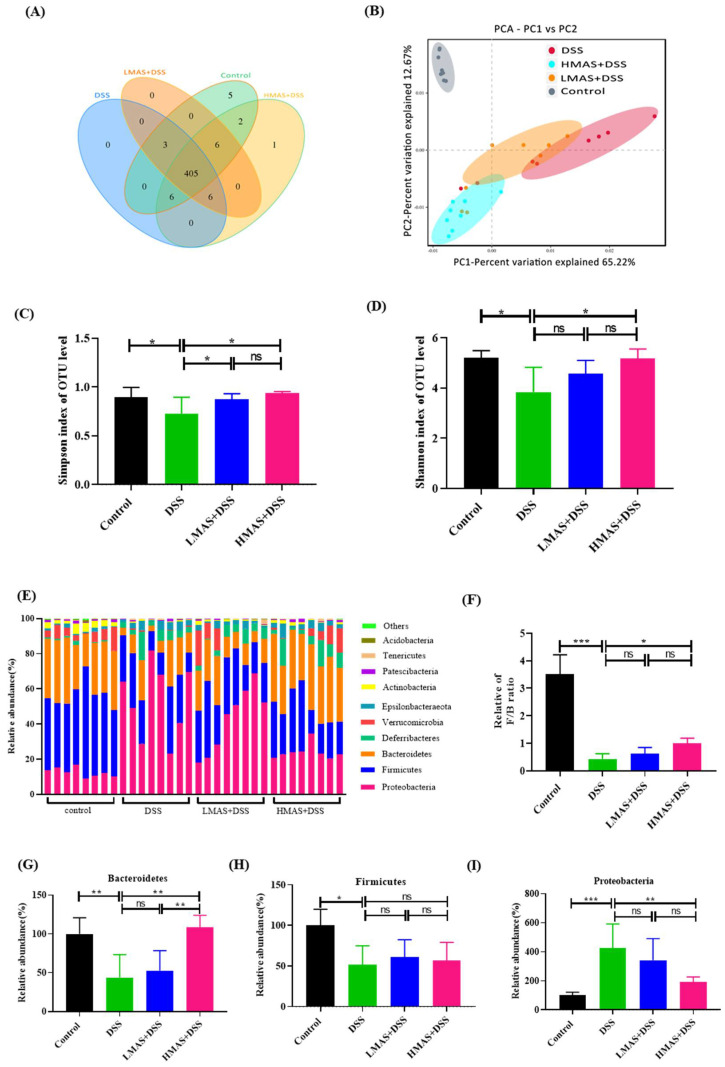
Figure 5.
MAS improved the gut microbiota disorder caused by DSS-induced colitis in mice. (A) Venn diagram showing the overlap of the operational taxonomic units (OTUs) identified in the gut microbiota among the four groups. (B) beta diversity analysis of intestinal microbiota among the four groups using the PCA method. (C) Simpson index of all samples. (D) Shannon index of all samples. (E) Bar chart of the bacterial community composition at the phylum level. (H) The Firmicutes to Bacteroidetes ratio. (F,G) Relative abundance of Bacteroidetes, Firmicutes at the phylum level, (I) Proteobacteria at the phylum level. Here, ns = not significant Data are shown as the mean ± SD. * p < 0.05, ** p < 0.01, *** p < 0.001, in comparison with the DSS group (n = 8).

