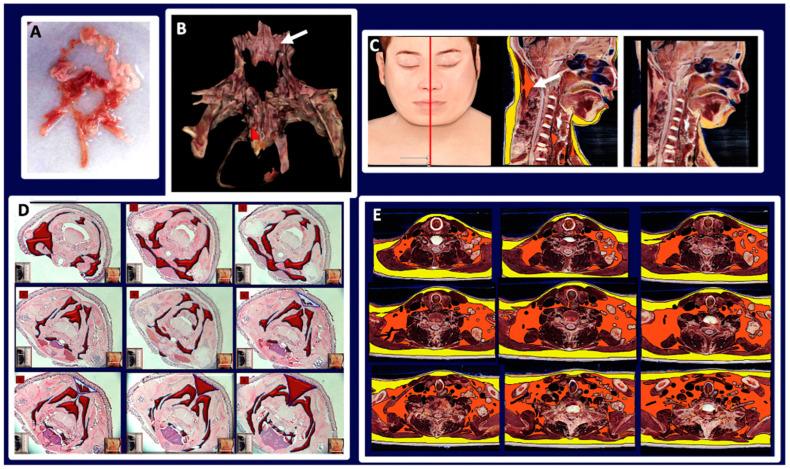
Figure 5.
Comparative data between mouse and human fat neckerchief. (A): Human fat neckerchief. (B): 3D reconstruction of the fat areas obtained through the entire set of Vicky’s cervical sections. Dorsal view, the deep neck brown fat mass is indicated by the arrow. (C): Vicky median sagittal section (left panel) in which the subcutaneous fat is highlighted in yellow and the brown fat in orange (central panel). The arrow indicates the deep neck brown fat also shown in (B). The right panel shows the original section with no highlights. (D,E) show a comparison between the brown fat forming the neckerchief in a mouse and in Vicky serial sections (original sections are shown in Supplementary Figures S7 and S15). Bars: 15 mm in (A), 60 mm in (B), 14 cm in (C), 15 mm in (D), 6 cm in (E).

