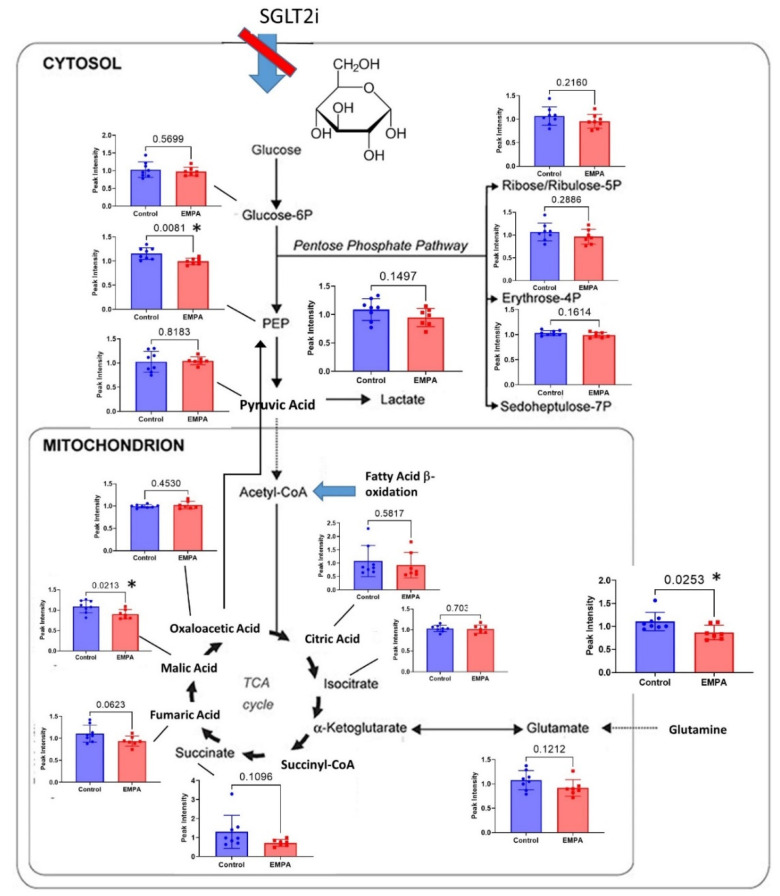
Figure 5.
Metabolites involved in glycolysis and oxidative phosphorylation in general, were reduced with EMPA-Control (blue) and EMPA-treated (red) bars showing individual mouse values and mean (SEM) for metabolites evaluated in these pathways (n = 8 control, n = 7 EMPA); * indicates a significant difference by unpaired t-test (p < 0.05). Phosphoenolpyruvate (PEP), malic acid, and glutamine were down-regulated with p < 0.05. Succinate was reduced, on average, 45%.

