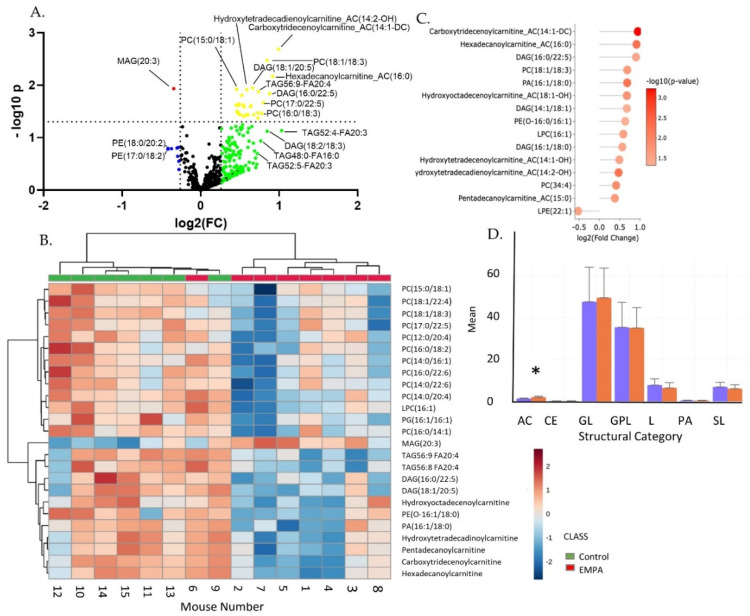
Figure 7.
Targeted lipidomics reveals a number of up-regulated species. (A) Volcano plot; (B) hierarchical clustering (top 25) of metabolites (by p-value); key shows relative levels of metabolites (log2 fold change); (C) highly-regulated species; (D) structural features. Acyl carnitines (AC), as a structural category, were up-regulated (* p < 0.05, by unpaired t-test).

