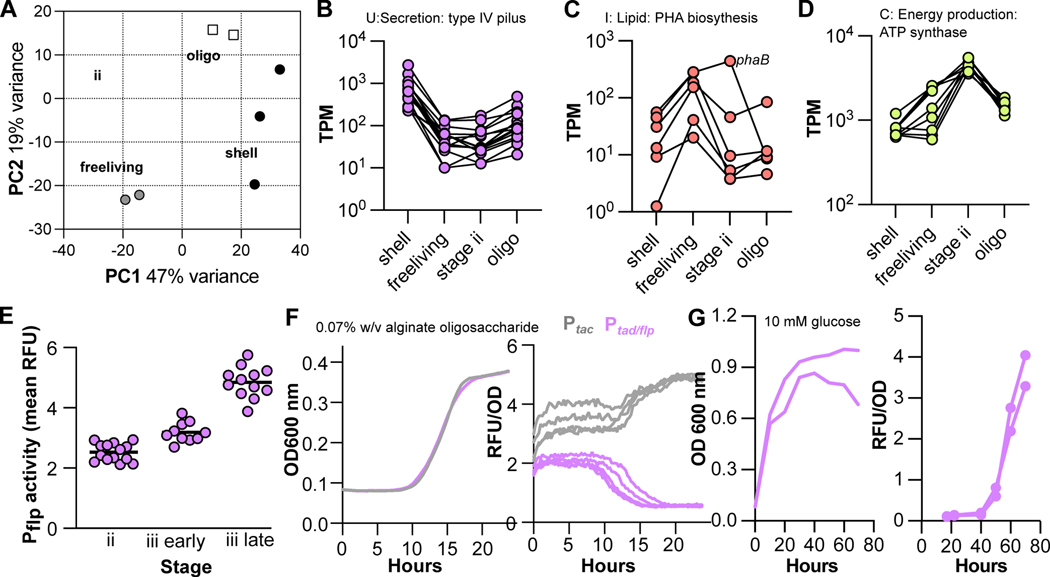
Figure 3. Transcriptional differences define cluster sub-populations.
A) Principal component analysis of normalized gene expression among samples. B-D Transcription of gene clusters specifically transcribed by cluster sample types. TPM, transcripts per million. Lines link the same gene across conditions. See Figure S3A for an analysis of all differentially expressed genes between pairs of samples. B) Transcription of type IV pili genes across sample types (V12B01_22456- V12B01_22516). C) Transcription of polhydroxybutyrate biosynthesis genes (V12B01_15106-V12B01_15126 and V12B01_24289) across sample types. D) Transcription of ATP synthase genes (VF12B01_01867–01907) across sample types. E) Transcriptional activity of tad/flp pili within clusters at timepoints during growth of 12B01 on alginate. Each data point represents the mean activity measured within an individual cluster. Timepoints were taken in the transition from stage ii to stage iii, as noted on the X axis. F) Activity of the tad/flp promoter or synthetic tac promoter during growth on alginate oligosaccharides. Growth of the reporter-containing strains is shown on the left, and fluorescent signal from the transcriptional reporters normalized by cell density (OD 600 nm) is shown on the right. Three replicates are plotted. G) Activity of the tad/flp promoter during growth and stationary phase of 12B01 in glucose defined minimal medium. As in F, cell density (right) and reporter activity (left) are plotted. Two replicates are shown. Figure S3B provides detailed information about the transcription of other biofilm-associated genes, and Figure S3C shows additional controls necessary for the development of the transcriptional reporter construct. See also Tables S1–S3.

