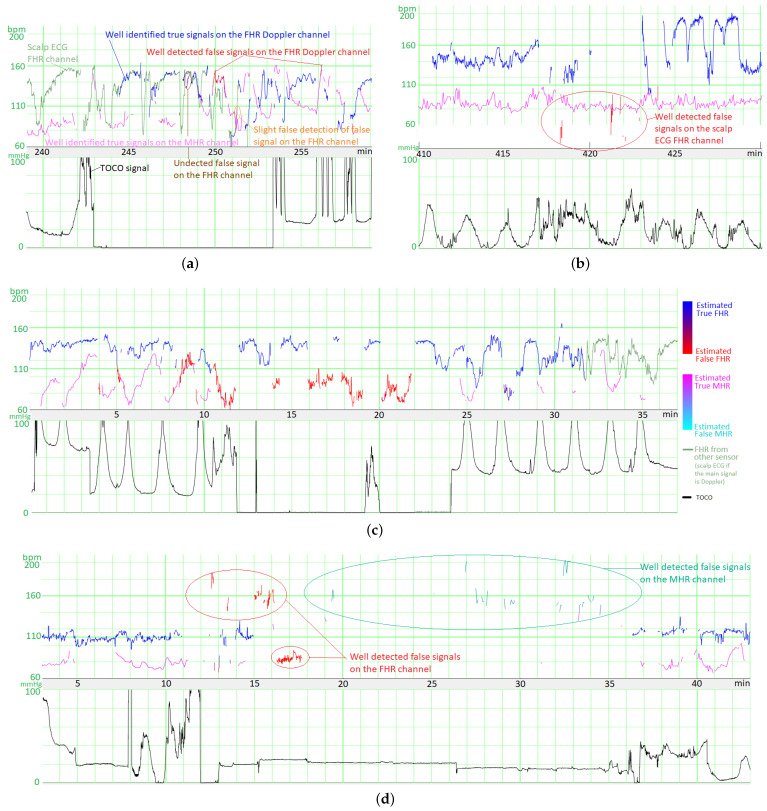
Figure 6.
Examples of results for the three models (FSMHR, FSDop and FSScalp). (a) Results for FSScalp with a recording from the first stage of delivery. (b) Results for FSScalp with a recording from the first stage of delivery. (c) Results for FSDop and FSMHR with a recording from the first stage of delivery. (d) Results for FSDop and FSMHR with a recording from the first stage of delivery, during the administration of an epidural. The likelihood of an FS estimated by each model is represented as a color gradient. On examples (a,c,d), the blue/red signal corresponds to the Doppler channel and the green signal corresponds to the scalp ECG channel. On example (b), the blue/red signal is the scalp ECG signal. On all recordings, the time lag in the MHR had been corrected (as described in Section 2.4).

