
Figure 4. Sankey diagram for illustration of cardiovascular disease spectrum interface.
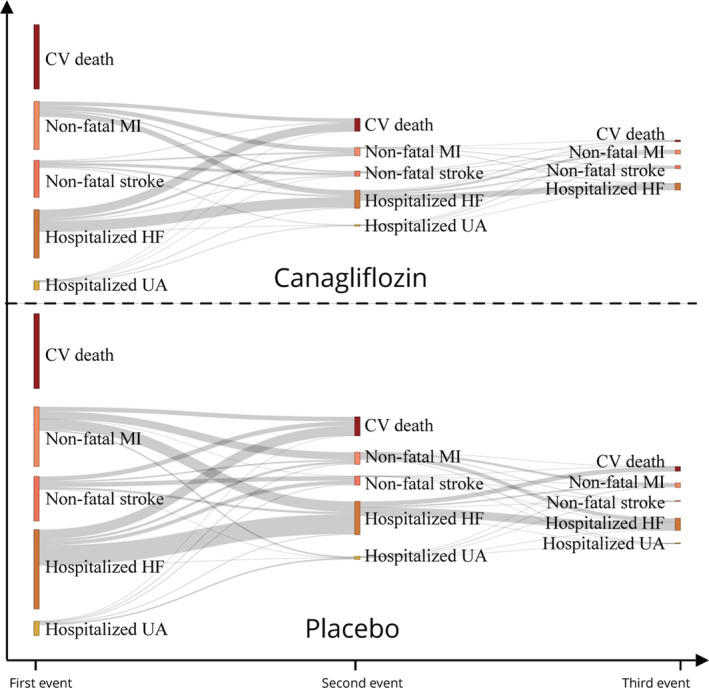
The Sankey plot depicts event transitions from the first to third events. Longer indicates more events. CV indicates cardiovascular; HF, heart failure; MI, myocardial infarction; and UA, unstable angina.