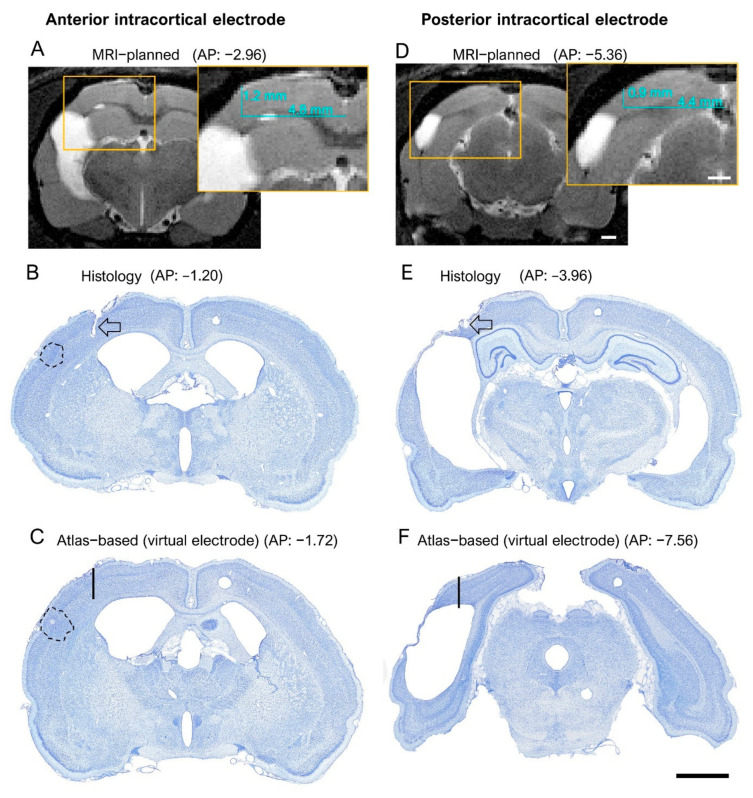
Figure 6.
Histological confirmation of the success of MRI-guided electrode placement. Left panel (A–C): Anterior intracortical electrode MRI-planned coordinate, histological confirmation, and “virtual” electrode. Right panel: Posterior intracortical electrode MRI-panned coordinate histological confirmation, and “virtual” electrode. (A) T2-weighted MRI and (B) histological images showing the MRI-guided (insert) and histology-confirmed “true” location of the anterior intracortical electrode in rat 1139. The anteroposterior (AP) coordinate was estimated by aligning the magnetic resonance images with the rat brain atlas [25]. The mediolateral (ML) and dorsoventral (DV) coordinates (inserts in (A,D)) were determined using ImageJ software (version 1.47v, Wayne Rasband and contributors, National Institute of Health, USA). Note that in this case, the confirmed AP location was about 1.8 mm more rostral than the planned location (−1.20 mm vs. −2.96). Lesion area is denoted in black-dashed-line circle. (C) A “virtual” location of the electrode tip (black line) if the electrode had been implanted to the targeted atlas-based coordinate (−1.75 mm from bregma, 4 mm from midline, 1.8 mm from the surface of the brain). (D) MRI-guided (insert) AP, ML and DV coordinates and (E) histology-confirmed “true” location of the posterior intracortical electrode tip in rat 1139. The black-dashed-line circle denotes the lesion area. Note that the confirmed AP location was approximately 1.4 mm more rostral than the planned location (−3.96 vs. −5.36). Thus, even though both the anterior and posterior intracortical electrodes were more rostral than planned, their tips were recording EEG signals in the perilesional cortex. (F) A “virtual” electrode (black line) at the atlas-based coordinates would have ended up in the lesion cavity. Scale bar in (A,D) = 1 mm, and in (B,C,E,F) = 2 mm.

