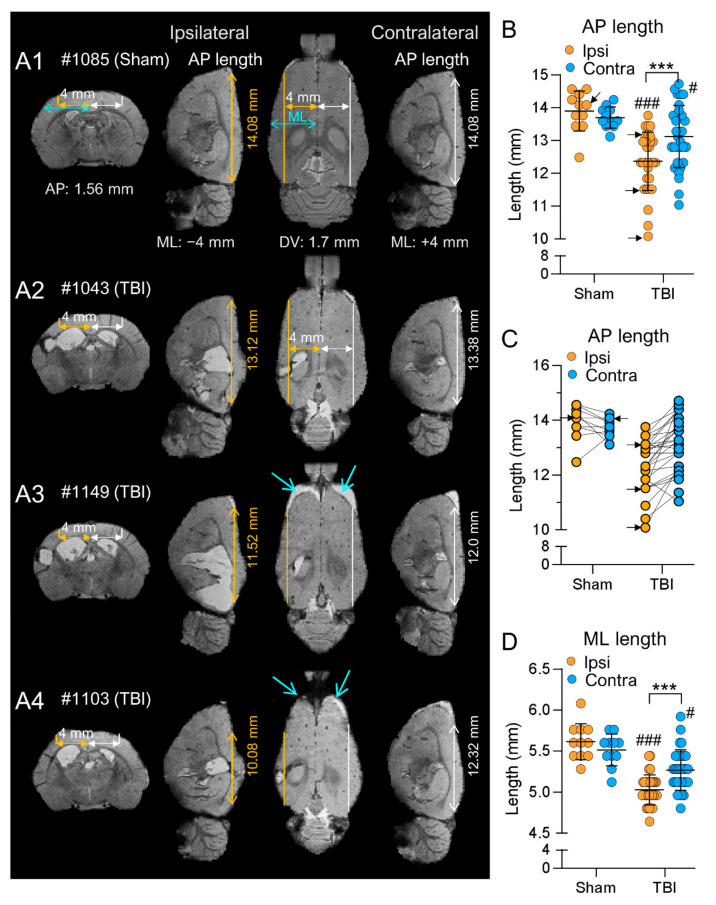
Figure 8.
Anteroposterior and mediolateral shrinkage of the brain. In vivo magnetic resonance 3D multigradient echo (MGRE) images acquired at 5 months after TBI were used to estimate cortical shrinkage in the MRI cohort. (A1–A4) coronal, sagittal (ipsilateral and contralateral) and horizontal MGRE images of a sham rat (A1) and TBI rats (A2–A4). Anteroposterior (AP) cortical shrinkage was estimated by measuring the distance between the rostral and caudal cortical surface (double-headed arrows) in the sagittal slice at 4 mm from the midline both ipsilaterally (orange) and contralaterally (white). Note the change in the shape of the ipsilateral cortex (sagittal images) in TBI rats, indicating the TBI-induced cortical atrophy (see also turquoise arrows in (A3,A4)). Mediolateral (ML) shrinkage was assessed by measuring the distance between the midline and the lateral edge of the cortex (turquoise double headed arrow) in a horizontal slice at 1.7 mm below the pial surface at AP level −1.56 (corresponding to the targeted location of the anterior intracortical electrode tip). (B) A dot plot showing the ipsilateral (orange) and contralateral (blue) cortical AP lengths (y-axis) in the sham and TBI groups (x-axis). Note that both the ipsilateral and contralateral cortical AP lengths were reduced in TBI rats compared with sham-operated animals. Also, in the TBI group, the cortical AP length was shorter ipsilaterally than contralaterally. (C) A paired dot plot showing that the ipsilateral vs. contralateral shrinkage in each rat. The greater the ipsilateral shrinkage, the greater the contralateral shrinkage in the TBI compared with sham group. Arrows point to the 3 cases illustrated in panels (A1–A4). (D) A dot plot showing the ipsilateral and contralateral cortical ML lengths in sham-operated and TBI rats. Note that both the ipsilateral and contralateral cortical ML lengths were reduced in TBI rats compared with sham-operated animals. Also, in the TBI group, the cortical ML length was shorter ipsilaterally than contralaterally. Statistical significance: *** p < 0.001 compared with the contralateral hemisphere (Wilcoxon signed-rank test); ### p < 0.001, # p < 0.05 compared with the sham group (Mann–Whitney U test).

