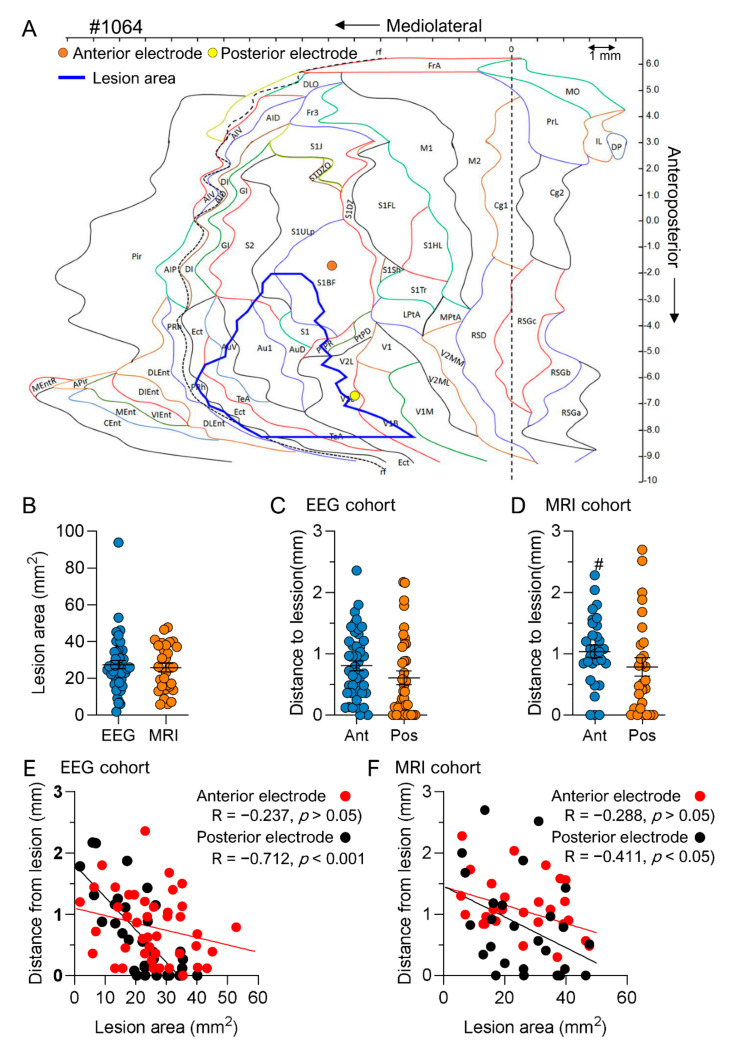
Figure 11.
Distance of the intracortical electrodes from the edge of the cortical lesion cavity. (A) An unfolded cortical map of a rat 1064, showing the cytoarchitectonic distribution of the cortical lesion (blue outline) and the location of the anterior (brown filled circle in the S1BF) and posterior (yellow filled circle in the V2L) intracortical electrodes. Note that the lesion had progressed laterally and caudally. Consequently, the posterior electrode was closer to the lesion cavity edge than the anterior electrode. (B) A scatter plot showing the cortical lesion area in the EEG and MRI cohorts (each dot represents 1 rat). The lesion area was comparable between cohorts (p > 0.05). (C) In the EEG cohort, the distance from the electrode tip to the lesion cavity edge (layer V intersection was used as reference) was similar between the anterior and posterior intracortical electrodes (p > 0.05). (D) In the MRI cohort, the distance from the anterior intracortical electrode tip to the cavity edge was slightly greater than that from the EEG cohort (p < 0.05). (E) In the EEG cohort, the larger the lesion, the closer the posterior electrode tip to the lesion cavity edge (p < 0.001). (F) In the MRI cohort, the larger the lesion, the closer the posterior electrode tip to the cavity edge (p < 0.001). Abbreviations: S1BF, primary somatosensory barrel field; V2L, secondary visual cortex lateral area. Statistical significance: #, p < 0.05 compared with the EEG cohort (Mann–Whitney U test).

