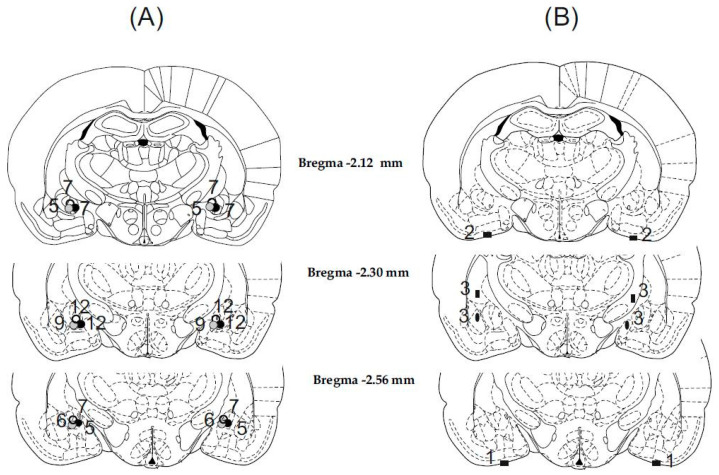
Figure 1.
Illustration of reconstructed injection sites. Correct bilateral injection placements are indicated by closed gray and black circles in the CeA in panel (A) (n = 70). Incorrect injection placements are indicated in panel (B) (n = 9). Brain structure diagrams of coronal sections are adapted from the stereotaxic atlas of Paxinos and Watson. The numbers refer to anterior–posterior distances from the bregma in mm. Identical symbols in panel (B) indicate coherent injection sites of bilateral injections. Numbers above marked sites in panels (A,B) indicate numbers of animals.

