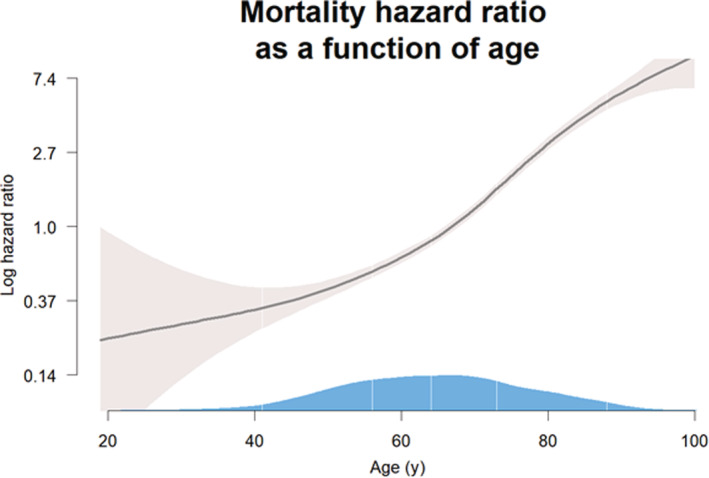
Figure 3. Smoothed spline Cox proportional hazard model for patient age at admission (x‐axis) and log‐transformed hazard ratio for mortality (y‐axis).

Gray shaded area is the 95% CI and the blue shaded area over the x‐axis the population density according to age, white lines denote the following percentiles from left to right: 2.5, 25, 50, 75, and 95.
