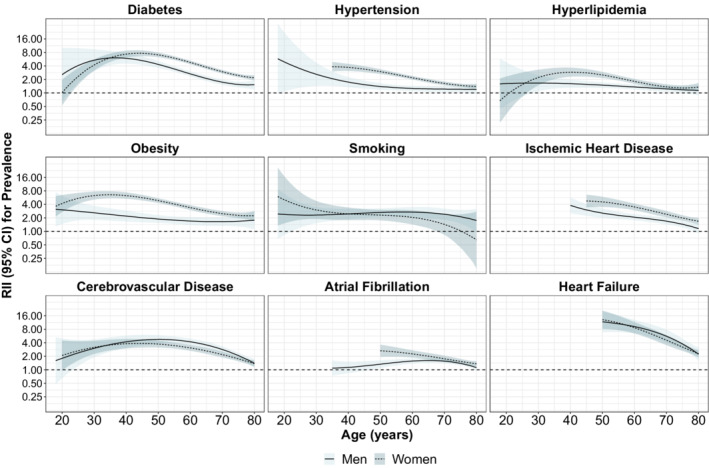
Figure 3. Relative index of inequality for income for the prevalence of 5 cardiovascular disease risk factors and 4 cardiovascular diseases, by age.

The relative index of inequality is calculated from a model with income (as an ordinal variable), with linear, quadratic and cubic polynomials for age, stratified by sex. We showed ages for which the sex/outcome combination has at least 5 cases in each income group. RII indicates relative index of inequality.
