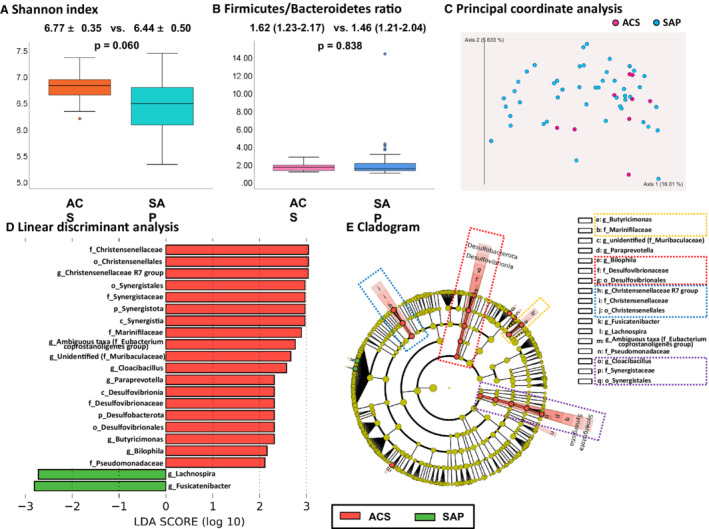
Figure 1. Difference in gut microbiota between patients presenting with ACS and those with SAP.

A, Shannon index. B, Firmicutes/Bacteroidetes ratio. C, Principal coordinate analysis did not show a clear tread. D, LDA showed that 5 bacteria at the family level (Christensenellaceae, Synergistaceae, Marinifilaceae, Desulfovibrionaceae, and Pseudomonadaceae) and 5 bacteria at the genus level (Christensenellaceae R7 group, Cloacibacillus, Paraprevotella, Butyricimonas, and Bilophila) (excluding unidentified bacteria and ambiguous taxa) were associated with ACS. Two bacteria at the genus level (Lachnospira and Fusicatenibacter) were associated with SAP. E, Cladogram showed the following lineages were associated with ACS: Desulfobacterota–Desulfovibrionia‐Desulfovibrionales–Desulfovibrionaceae‐ Bilophila, Synergistota–Synergistia–Synergistales–Synergistaceae–Cloacibacillus, Christensenellales–Christensenellaceae‐Christensenellaceae R7 group, and Marinifilaceae–Butyricimonas. ACS indicates acute coronary syndrome; c_, class level; f_, family level; g_, genus level; LDA, linear discriminant analysis; o_, order level; p_, phylum level; and SAP, stable angina pectoris.
