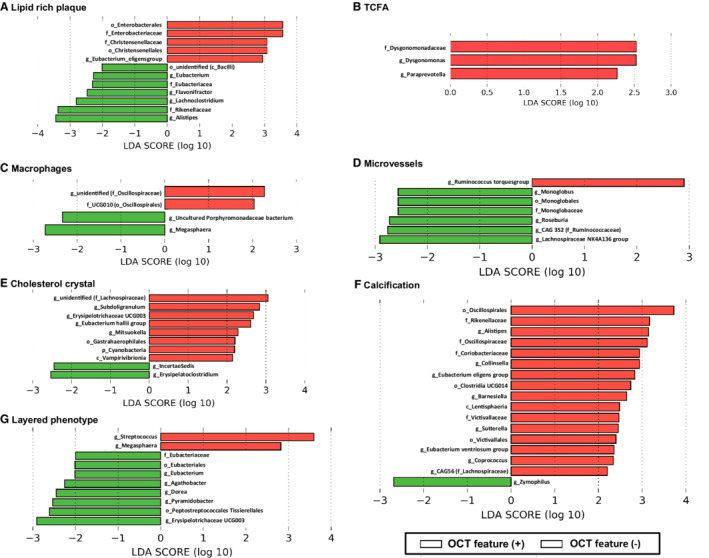
Figure 2. Gut bacteria that are associated with specific qualitative OCT features in linear discrimination analysis.

The figure shows the gut bacteria that are associated with lipid rich plaque (A), TCFA (B), macrophages (C), microvessels (D), cholesterol crystal (E), calcification (F), and layered phenotype (G) in LDA. c_ indicates class level; f_, family level; g_, genus level; LDA, linear discrimination analysis; o_, order level; OCT, optical coherence tomography; p_, phylum level; and TCFA, thin‐cap fibroatheroma.
