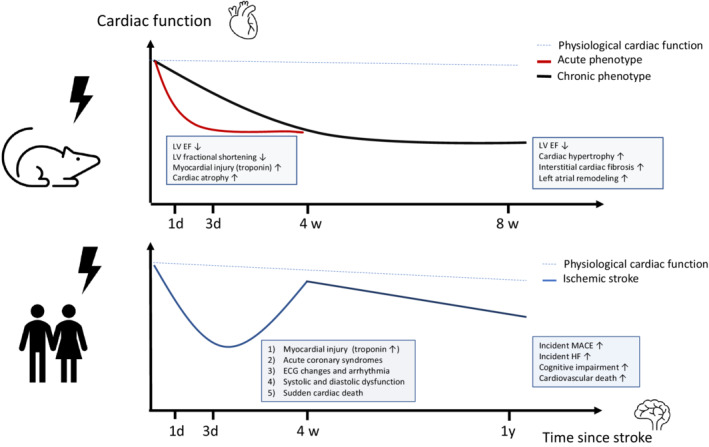
Figure 2. Phenotypes and time course of the stroke–heart syndrome in rodent models and clinical practice.

(Top) Phenotype observed in rodent ischemic stroke models. The dashed blue line indicates physiological cardiac function. The red line indicates the severity of acute cardiac dysfunction that peaks within 24 to 72 hours and persists up to 14 days after experimental stroke. Note that this phenotype was most consistently inducible by severe brain ischemia. The black line indicates a phenotype of chronic cardiac dysfunction starting 4 to 8 weeks after experimental brain ischemia. Note that this phenotype was most consistently inducible by mild, right‐sided brain ischemia. (Bottom) Spectrum and time‐course of stroke–heart syndrome observed in human clinical studies. The dashed blue line indicates physiological trajectory of cardiac function during aging. The blue line indicates the trajectory of cardiac alterations after stroke observed in observational clinical studies. Note that there is large individual variability, and that further studies are needed to predict the incidence of long‐term cardiovascular outcomes and heart failure. EF indicates ejection fraction; HF, heart failure; LV, left ventricular; and MACE, major adverse cardiovascular events.
