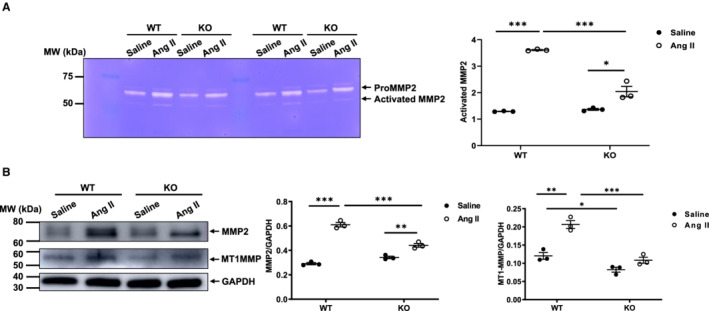
Figure 4. Angiotensin II activation of aortic MMP2 is dependent on MFG‐E8.

A, Representative zymograms of aortic gelatinases (left panel). Quantitative graph shows activated MMP2 protein abundance (P<0.001 for main treatment effect, P<0.001 for main genotype effect, P<0.001 for treatment×genotype, by 2‐way ANOVA). Graph (right panel) showing mean±SEM with individual data for knockout and WT mice with angiotensin II or saline infusion. *P<0.05 and ***P<0.001 by Bonferroni post hoc tests following 2‐way ANOVA. B, Representative western blots of aortic MMP2, MT1MMP, and GAPDH (left panel). Quantitative data of aortic MMP2 protein abundance (P<0.001 for main treatment effect, P<0.01 for main genotype effect, P<0.01 for treatment×genotype, by 2‐way ANOVA) (middle panel). Quantitative data of aortic MT1MMP2 protein abundance (P<0.001 for main treatment effect, P<0.01 for main genotype effect, P<0.01 for treatment×genotype, by 2‐way ANOVA). Graph (right panel) showing mean±SEM with individual data for knockout and WT mice with angiotensin II or saline infusion. *P<0.05, **P<0.01, and ***P<0.001 by Bonferroni post hoc tests following 2‐way ANOVA. Ang II indicates angiotensin II; IMT, intimal medial thickness; KO, knockout; MFG‐E8, milk fat globule–epidermal growth factor VIII; MMP2, matrix metalloproteinase type 2; MT1MMP, type I of MMP activator; MW, molecular weight; and WT, wild‐type.
