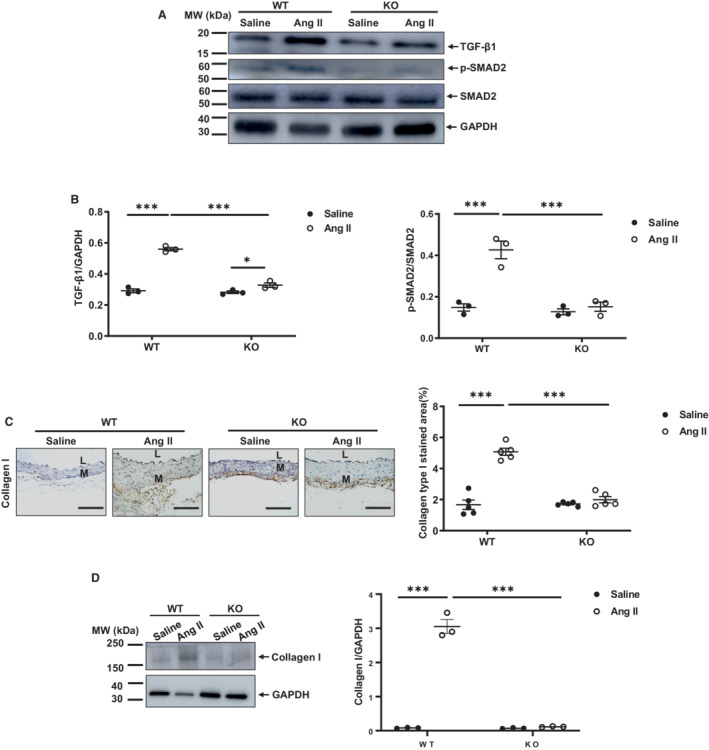
Figure 5. Angiotensin II increases aortic TGF‐β1 fibrotic signaling through MFG‐E8.

A, Representative western blots of aortic TGF‐β1, p‐SMAD2, and SMAD2. B, Quantitative data of aortic activated TGF‐β1 protein abundance (P<0.001 for main treatment effect, P<0.001 for main genotype effect, P<0.001 for treatment×genotype, by 2‐way ANOVA) (left panel). Quantitative data of aortic p‐SMAD2/SMAD2 ratio (P<0.001 for main treatment effect, P<0.001 for main genotype effect, P<0.01 for treatment×genotype, by two‐way ANOVA). Graph (right panel) showing mean±SEM with individual data for knockout and WT mice with angiotensin II or saline infusion. *P<0.05 and ***P<0.001 by Bonferroni post hoc tests following 2‐way ANOVA. C, Photomicrographs of immunostaining collagen type I. Morphometric analysis shows relative collagen I immunostaining area (%) (P<0.001 for main treatment effect, P<0.001 for main genotype effect, P<0.001 for treatment×genotype, by 2‐way ANOVA). Graph (far right panel) showing mean±SEM with individual data for knockout and WT mice with angiotensin II or saline infusion. ***P<0.001 by Bonferroni post hoc tests following 2‐way ANOVA. D, Representative western blots of aortic collagen I. Quantitative data of aortic collagen I (P<0.01 for main treatment effect, P>0.05 for main genotype effect, P<0.0001 for treatment×genotype, by 2‐way ANOVA). Graph (right panel) showing mean±SEM with individual data points for knockout and WT mice with angiotensin II or saline infusion. ***P<0.001 by Bonferroni post hoc tests following 2‐way ANOVA. Scale bar=100 μm. Ang II indicates angiotensin II; KO, knockout; L, lumen; M, media; MW, molecular weight; p‐SMAD2, phosphorylated mother against decapentaplegic homolog 2; SMAD2, mother against decapentaplegic homolog 2; TGF‐β1, transforming growth factor beta 1; and WT, wild‐type.
