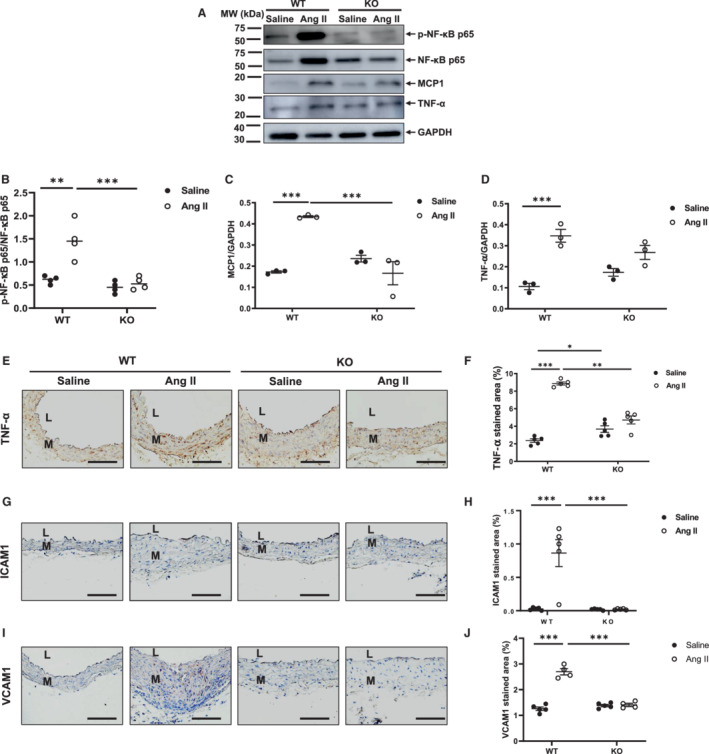
Figure 6. Angiotensin II activation of NF‐κB signaling and its downstream proinflammatory effects require MFG‐E8.

A, Representative western blots of aortic p‐NF‐κB p65, NF‐κB p65, MCP‐1, TNF‐α, and GAPDH. B, Quantitative data of p‐NF‐κB p65 protein abundance (P<0.001 for main treatment effect, P<0.01 for main genotype effect, P<0.001 for treatment×genotype, by 2‐way ANOVA). Graph showing mean±SEM and individual data points for knockout and WT mice with angiotensin II or saline infusion. **P<0.01 and ***P<0.001 by Bonferroni post hoc tests following 2‐way ANOVA. C, Quantitative data of MCP1 protein abundance (P<0.01 for main treatment effect, P<0.05 for main genotype effect, P<0.001 for treatment×genotype, by two‐way ANOVA). Graph showing mean±SEM with individual data points for knockout and WT mice with angiotensin II or saline infusion. ***P<0.001 by Bonferroni post‐hoc tests following two‐way ANOVA. D, Quantitative data of TNF‐α protein abundance (P<0.001 for main treatment effect, P>0.05 for main genotype effect, P<0.05 for treatment×genotype, by two‐way ANOVA). Bar graph showing mean±SEM with individual data points for knockout and WT mice with angiotensin II or saline infusion. ***P<0.001 by Bonferroni post hoc tests following 2‐way ANOVA. E, Photomicrographs of immunostaining of TNF‐α. F, Quantitative data of aortic TNF‐α immunostaining area (%) (P<0.01 for main treatment effect, P<0.05 for main genotype effect, P<0.01 for treatment×genotype, by two‐way ANOVA). Graph showing mean±SEM with individual data for KO and WT mice with angiotensin II or saline infusion. *P<0.05, **P<0.01, and ***P<0.001 by Bonferroni post hoc tests following two‐way ANOVA. G, Photomicrographs of immunostaining ICAM1. H, Morphometric analysis of relative ICAM1 immunostaining area (%) (P<0.001 for main treatment effect, P<0.001 for main genotype effect, P<0.001 for treatment×genotype, by 2‐way ANOVA). Graph showing mean±SEM with individual data for knockout and WT mice with angiotensin II or saline infusion. ***P<0.001 by Bonferroni post hoc tests following 2‐way ANOVA. I, Photomicrographs of immunostaining VCAM1. J. Morphometric analysis of relative VCAM1 immunostaining area (%) (P<0.001 for main treatment effect, P<0.001 for main genotype effect, P<0.001 for treatment×genotype, by two‐way ANOVA). Graph showing mean±SEM with individual data for knockout and WT mice with angiotensin II or saline infusion. ***P<0.001 by Bonferroni post‐hoc tests following 2‐way ANOVA. Scale bar=100 μm. Ang II indicates angiotensin II; ICAM1, intercellular adhesion molecule 1; KO, knockout; L, lumen; M, media; MCP1, monocyte chemoattractant protein 1; MFG‐E8, milk fat globule–epidermal growth factor VIII; MW, molecular weight; NF‐κB p65, nuclear factor‐kappa beta p65; p‐NF‐κB p65, phosphorylated nuclear factor‐kappa beta p65; VCAM1, vascular cell adhesion molecule 1; TNF‐α, tumor necrosis factor alpha; and WT, wild‐type.
