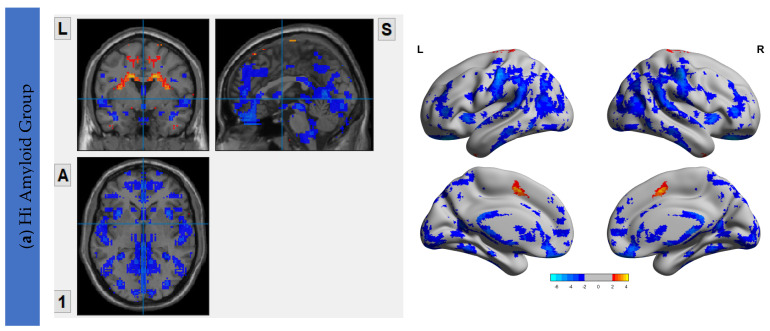
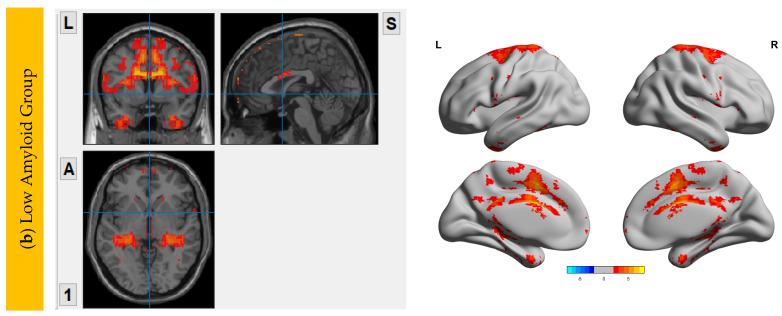
Figure 2.
VMHC Maps showing interhemispheric functional connectivity (IFC) of HiAmy and LowAmy groups when compared to HC. (a) showed Voxel-wise two-sample t-tests of VMHC maps from HiAmy when compared to HC. (b) showed Voxel-wise two-sample t-tests of VMHC maps from LowAmy when compared to HC. All comparisons were adjusted for age, sex, and total intracranial volume, with Gaussian random field correction. The significance threshold at the voxel level was set at p < 0.01; and at cluster level was set at p < 0.05. The blue and red colors illustrate significant t values according to the scale on the right. VMHC: Voxel Mirrored Homotopic Connectivity. HC: Health Control. HiAmy: Patient group with global SUVr > 0.62. LowAmy: Patient group with global SUVc < 0.62.


