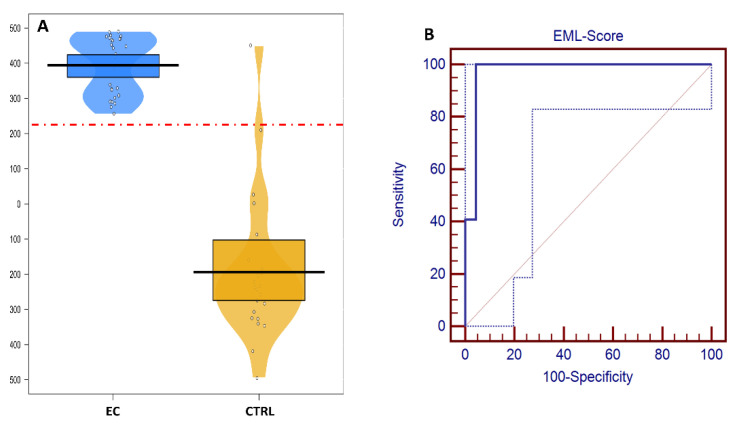
Figure 2.
(A) Ensemble Machine Learning (EML) scores of healthy controls (CTRL, blue) and endometrial cancer (EC, orange)-affected patients; the red dashed line represents the Youden index-based optimized cut-off value. (B) Receiver operating characteristic (ROC) curve obtained by varying the cut-off value when applying the EML model to the test set. Dotted blue line represents the 95% confidence bounds.

