
Figure 3.
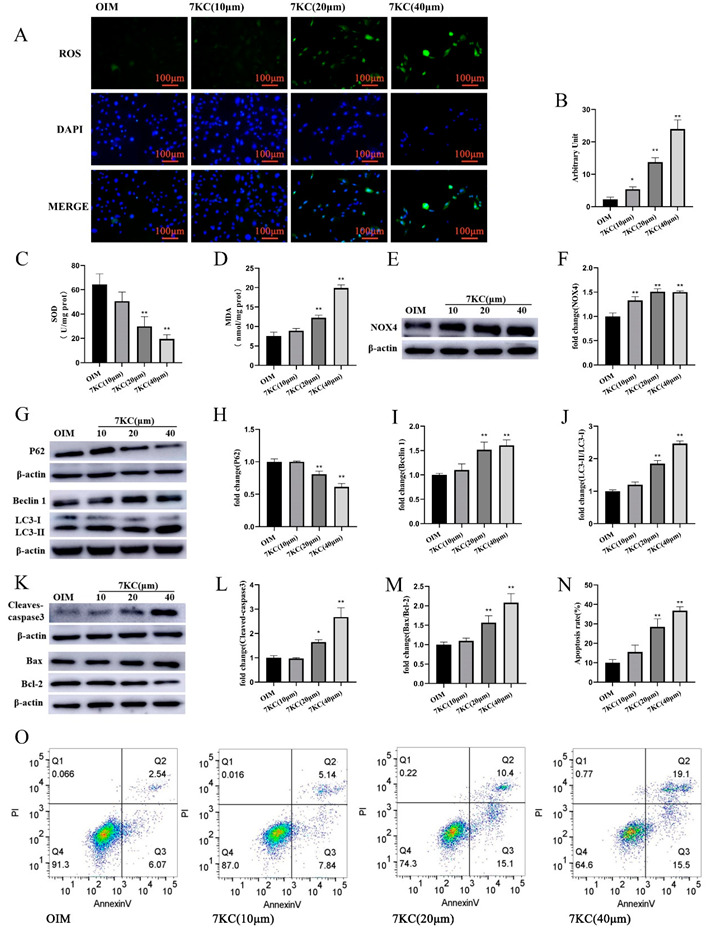
7KC regulated oxiapoptophagy in MC3T3-E1 cells. (A) Cells were prepared for staining with DCFH-DA and DAPI, respectively, and analyzed by a fluorescence microscope (×200 magnification). (B) Quantitative analysis of ROS production. (C,D) SOD activity detection, and MDA level measurement were conducted using the kits. (E,F) The protein expression of NOX4 was analyzed by Western blot. (G–J) The protein expression of LC3I/II, Beclin1, and P62 was detected. (K–M) The protein expression of Bax/Bcl-2 and cleaved caspase-3 was measured. (N,O) Apoptosis analysis was conducted by flow cytometry. Data were analyzed and compared with the OIM group. * p < 0.05; ** p < 0.01. OIM, osteogenic induction medium; NC, negative control.