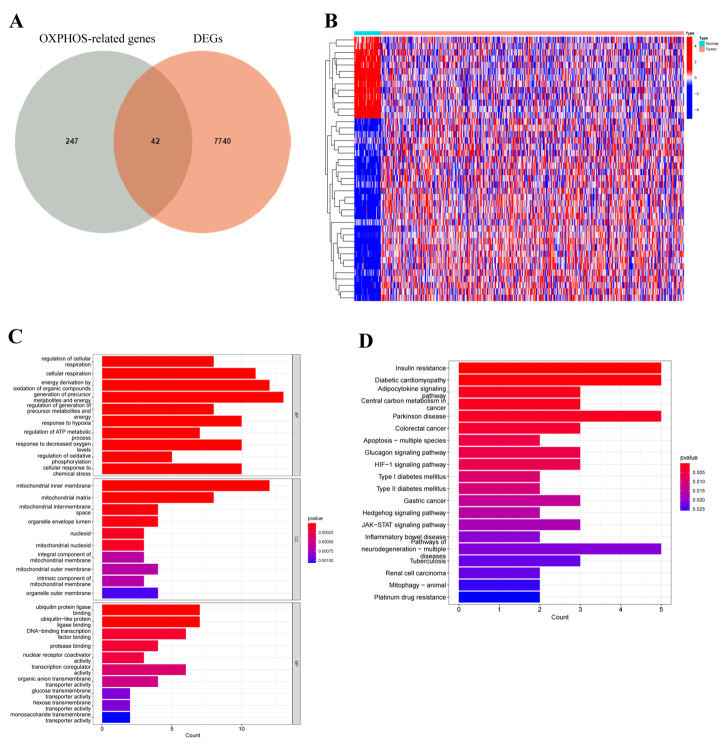
Figure 1.
Differential expression analysis and functional annotation of oxidative phosphorylation (OXPHOS)-related gene in patients with COAD. (A) Venn diagram revealed the distribution of DEGs and ORGs in COAD. (B) The heatmap depicted the different expressions of ORGs between tumor and normal tissues. Blue blocks indicated lower expression and red blocks represented higher expression. (C,D) GO terms and KEGG pathway enriched in differentially expressed ORGs.

