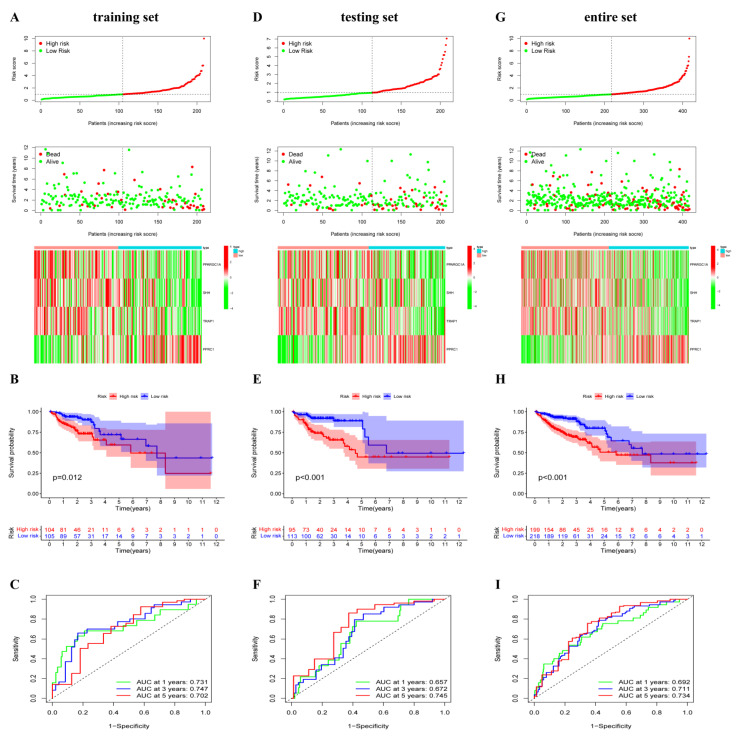
Figure 2.
Construction and validation of the oxidative phosphorylation (OXPHOS)-related gene prognostic signature in the training, testing and entire set. (A,D,G) The risk curve displayed risk score distribution of high-risk and low-risk groups. Scatter plot distributed the survival status and survival time, heatmap showed the expression profiles of four ORGs in high-risk and low-risk groups. (B,E,H) Kapan-Meier survival curves for overall survival (OS) of patients in high-risk and low-risk groups. (C,F,I) ROC analysis of risk score in predicting prognoses.

