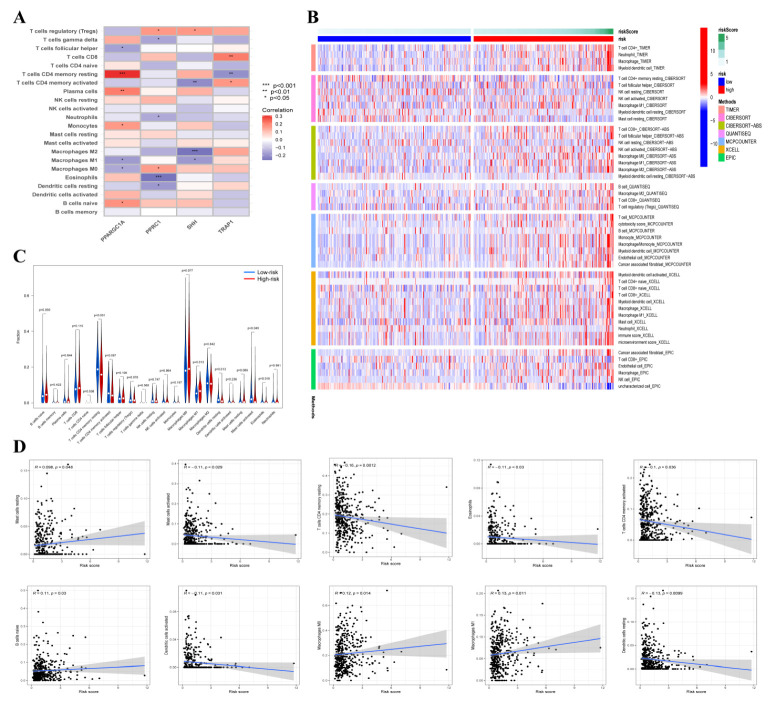
Figure 6.
The correlation between risk score and tumor-infiltrating immune cell (TICs). (A) The relationship between four OXPHOS-related gene expression level and TICs. Red indicates positive correlation while blue indicates negative correlation. (B) The infiltration of 21 types of immune cells in high-risk and low-risk groups was estimated by TIMER, CIBERSORT, CIBERSORT-ABS, QUANTISEQ, MCPCOUNTER, XCELL and EPIC database. (C) Comparison of TICs in high-risk and low-risk groups. (D) The correlation between risk score and immune cells, and the results significant differences were shown.

