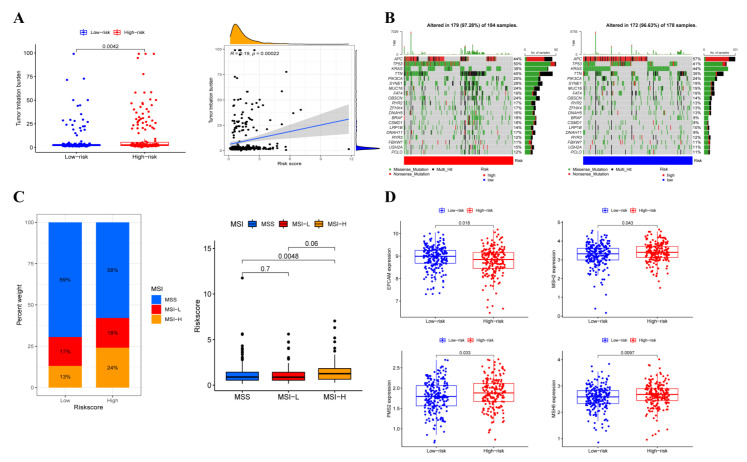
Figure 7.
The relationship between TMB and risk score. (A) The difference between TMB in high-risk and low-risk groups and the correlation between TMB and risk score. (B) Waterfall plot revealed the mutation information of genes with high mutation frequency in high-risk and low-risk groups. (C) The proportion of different microsatellite states and the risk score of three microsatellite states in different risk groups. (D) The expression of EPCAM, MSH2, PMS2 and MSH6 in two risk groups.

