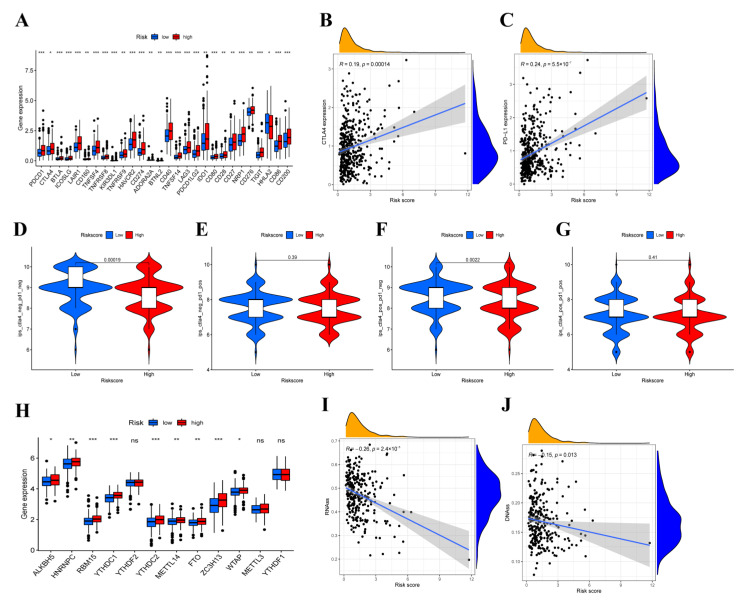
Figure 8.
The results of immune checkpoint and immunophenoscore (IPS). (A)The expression of immune checkpoint genes and the correlation between risk score and CTLA4 expression (B) and PD-L1 expression (C). (D–G) The differences of IPS in patients with different risk score. (H) The expression level of main genes of m6A in high-risk and low-risk groups. (I,J) Relationship between risk score and RNAss, DNAss. Adjusted p-values were shown as ns, not significant, * p < 0.05, ** p < 0.01, *** p < 0.001.

