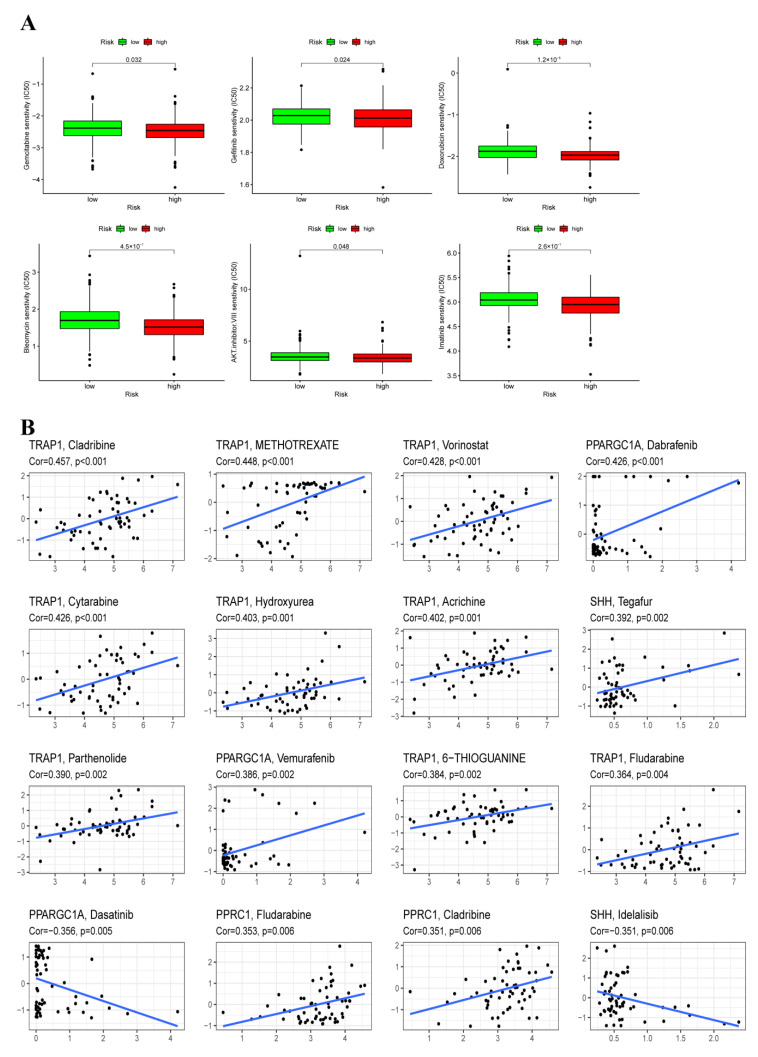
Figure 9.
Prediction of the response to common chemotherapy drugs between the low-risk and high-risk groups. (A) Estimation of IC50 value for Gemcitabine, Gefitinib, Cisplatin, Bleomycin, AKT. inhibitor. VIII, Imatinib. (B) Scatter plot of the association between three ORGs expression and drug sensitivity.

