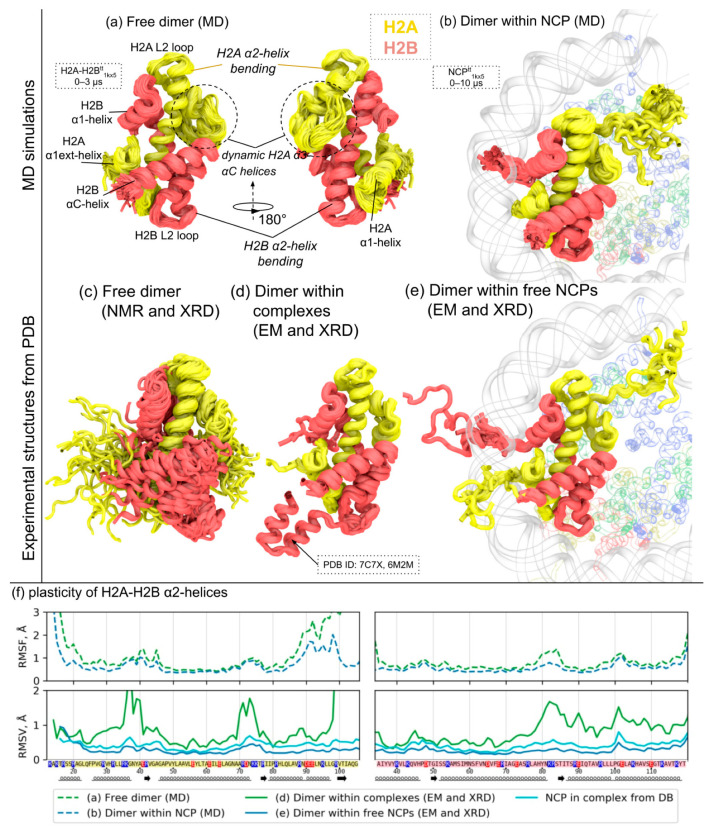
Figure 2.
H2A-H2B dimer dynamics in molecular dynamics (MD) simulations and experimental data. (a,b) Overview of H2A-H2B dimer dynamics in MD simulations as a free dimer (a) or in the context of NCP (b). MD snapshots spaced 10 ns apart are overlaid. The respective IDs of simulated systems are depicted in dashed boxes (see Table S1 for system description). (c–e) Overview of structural variation in H2A-H2B dimers observed in PDB, grouped by structure type and experimental origin: (c) superimposed structures of free H2A-H2B dimers resolved via X-ray crystallography (XRD) and structural models from NMR studies, (d) superimposed structures of H2A-H2B dimers from complexes with other proteins (except nucleosomes), (e) superimposed structures of H2A-H2B dimers in the context of free NCPs found in PDB. PDB IDs of depicted structures can be found in Table S2. (f) Analysis of structural fluctuations and variations for Cα-atoms of H2A (left) and H2B (right) histones. The plots show the values of either root-mean square fluctuations (RMSF) from MD or root-mean square variations (RMSV) of atomic positions between PDB structures of a given group (see legend). Each group of experimental structures or MD simulations is represented by a separate line according to the legend.

