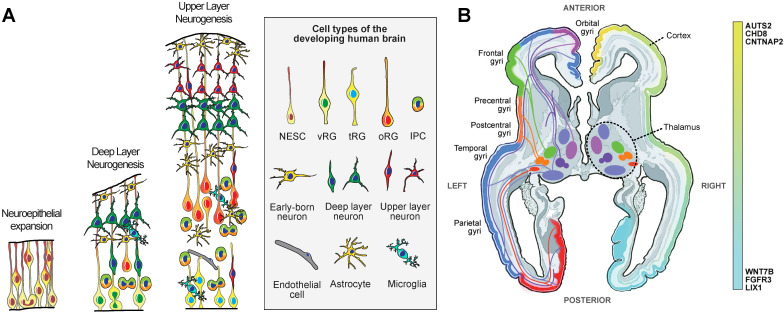
Figure 2.
Development of the human brain. (A) Schematic representation of the key cellular populations during stages of peak neurogenesis and early gliogenesis in the human cerebral cortex. NESC—neuroepithelial stem cells, vRG—ventricular radial glia, tRG—truncated radial glia, oRG—outer radial glia, IPC-intermediate progenitor cells. (B) Development of the long-range connectivity between prospective subdivisions of the thalamus and cortical areas. The schematic shows a horizontal section through a developing human brain. The left half highlights major projection pathways between the emerging thalamic nuclei and cortical areas. The right half highlights differences in expression levels of specific genes with rostro-caudal expression gradients.

