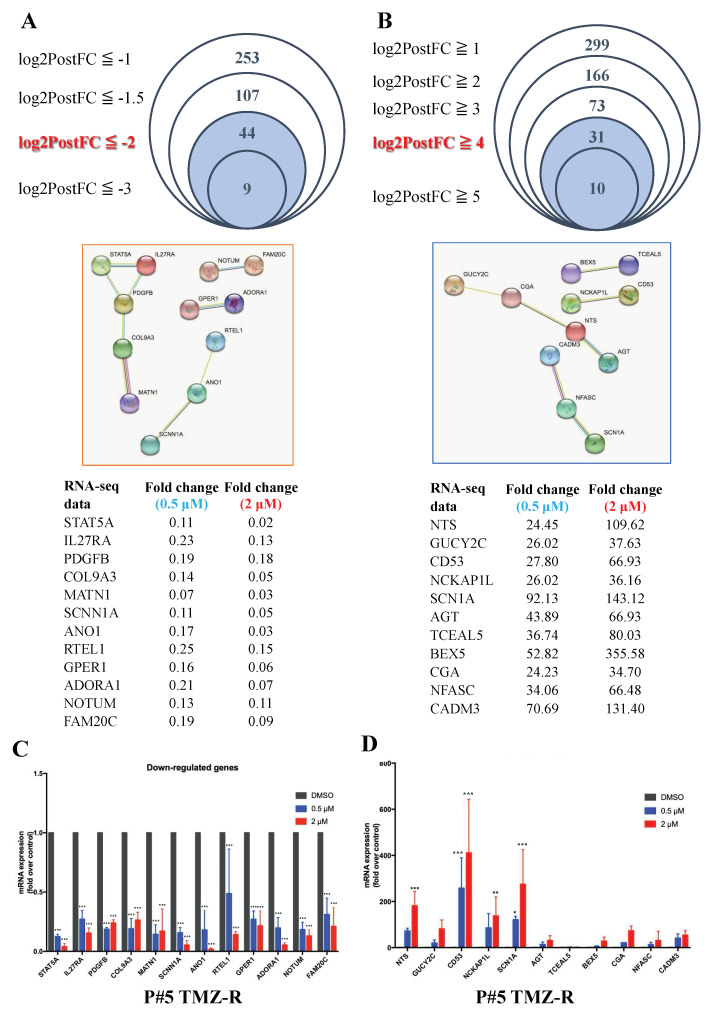
Figure 4.
Intergroup comparison of the RNA-seq data after LMK235 treatment. (A) Forty-four DEGs were selected by the criterion of log2PostFC < −2, and 12 DEGs were further selected by screening their linkage to each other in the STRING database. (B) Thirty-one DEGs were selected by the criterion of log2PostFC > 4, and 11 DEGs were selected by screening their linkage to each other in the STRING database. The upregulated (C) and downregulated (D) mRNA expression levels of the DEGs mentioned above were verified by qPCR. * indicates comparison with vehicle; mean ± SEM. * p < 0.05, ** p < 0.01, *** p < 0.001.

