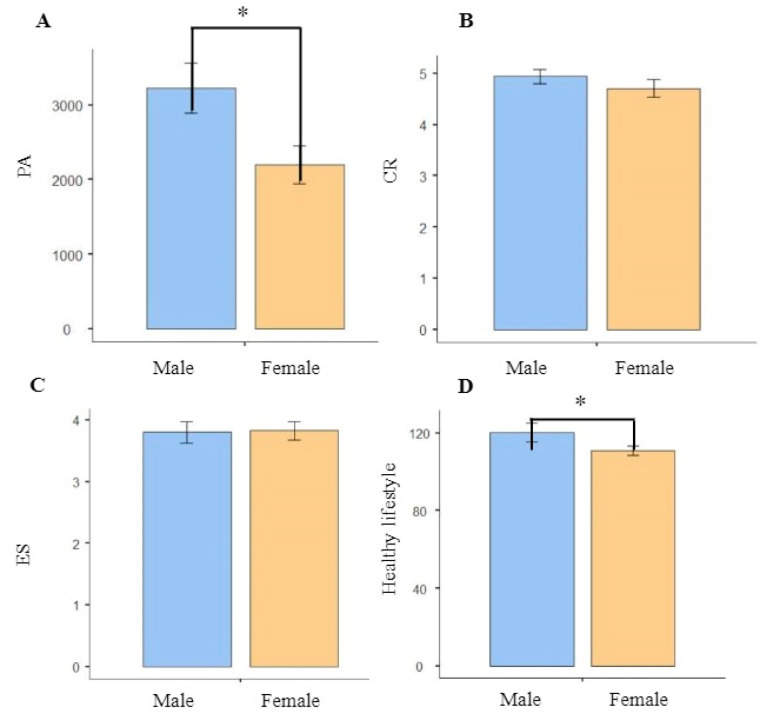
Figure 1.
(A) Comparison graph of male and female in PA. (B) Comparison graph of male and female in CR. (C) Comparison graph of male and female in ES. (D) Comparison graph of male and female in healthy lifestyle. Abbreviations: PA, physical activity; CR, cognitive reappraisal; ES, expressive suppression. Note: * Denotes significant differences at p < 0.05.

