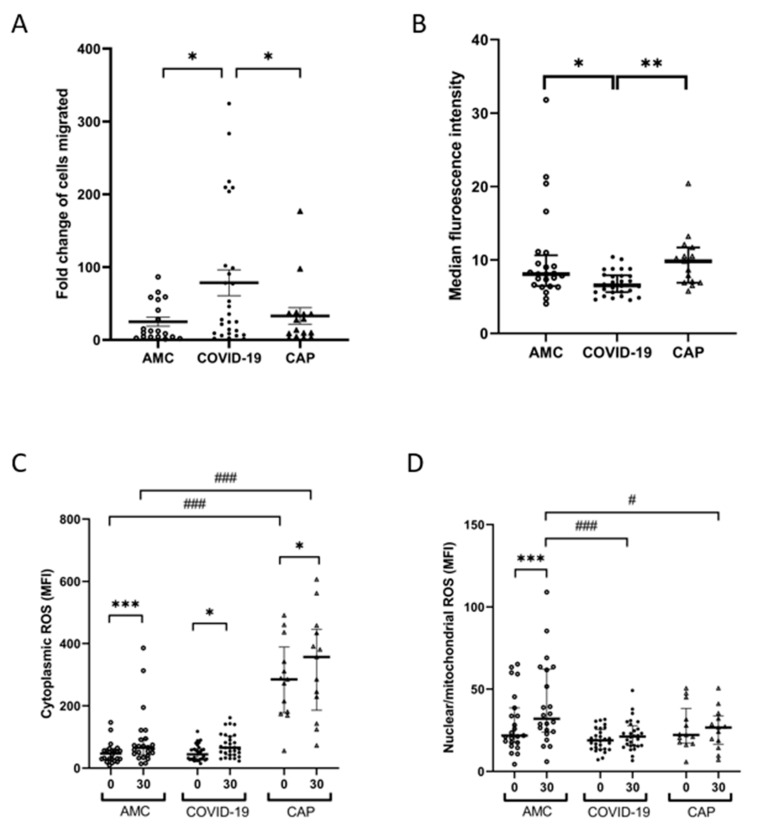
Figure 2.
Neutrophil functional responses in COVID-19. (A) Neutrophil transmigration towards CXCL-8. Data shows fold change in neutrophils migrated to CXCL-8 compared to vehicle control. * p = 0.0332 AMC (n = 18) vs. COVID-19 (n = 28), * p = 0.0332 CAP (n = 10) vs. COVID-19 (n = 28). (B) Neutrophil phagocytosis of opsonized S. pneumoniae following a 30-min incubation. Data shows MFI of positive neutrophils. * p = 0.0366 AMC (n = 24) vs. COVID-19 patients (n = 30), ** p = 0.0052 CAP (n = 15) vs. COVID-19 (n = 30). (C) Cytoplasmic ROS levels measured in neutrophils at baseline (0 min) and after phagocytosis. *** p < 0.0091 AMC (n = 24), * p = 0.038 CAP (n = 7). CAP patients showed elevated baseline cROS (### p < 0.0001) and after phagocytosis (### p < 0.0001) vs. AMC. (D) Nuclear/mitochondrial ROS levels in neutrophils at baseline (0 min) and after phagocytosis. *** p < 0.0001 AMC. COVID-19 (### p < 0.0001) and CAP patients (# p = 0.0101) showed reduced n/mROS after phagocytosis compared to AMC.

