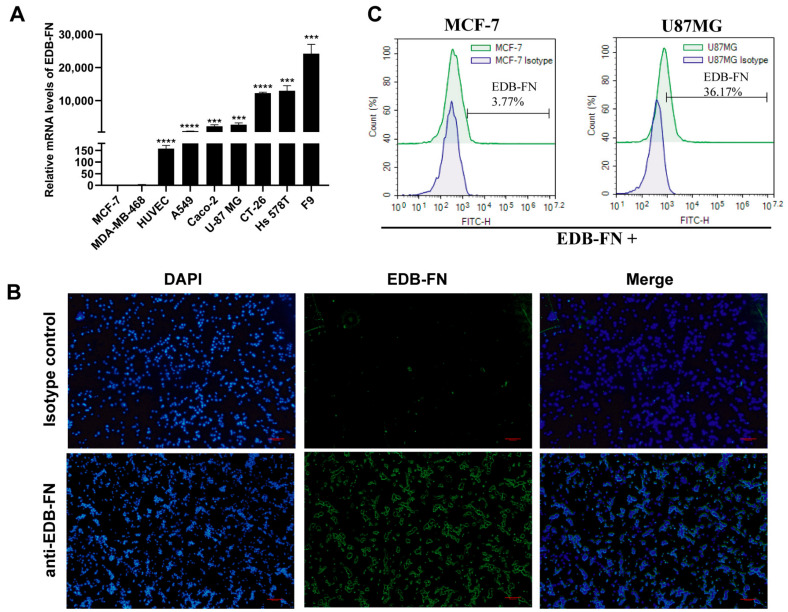
Figure 1.
Analysis of EDB-FN expression in human cancer cells and HUVECs. (A) EDB-FN protein expression levels in different cells detected by qPCR. (B) The EDB-FN expression test on U-87 MG tumor cells by immunofluorescence staining. (C) EDB-FN expression test on U-87 MG and MCF-7 tumor cells by flow cytometry. Datapoints reflect the mean ± SD of triplicates (*** p < 0.001; **** p < 0.0001; two-tailed Student’s t-test).

