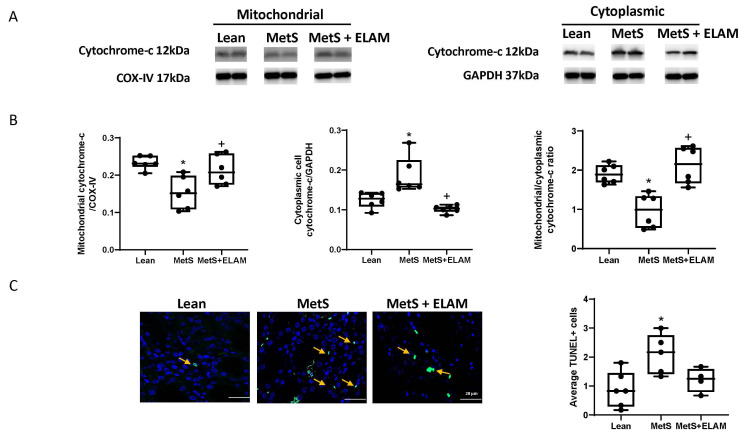
Figure 3.
The degree of renal cell apoptosis in MetS was assessed by: (A,B) Cytochrome-c expression in mitochondrial compared to the cellular fraction. (C) TUNEL staining (yellow arrows showing apoptotic signals); Apoptosis increased in MetS and partly decreased in MetS + ELAM, suggesting improved mitochondrial function and cell survival. * p < 0.05 vs. lean, + p < 0.05 vs. MetS. Mean and median are shown as horizontal lines and accent marks, respectively. Scale bar = 20 µm.

