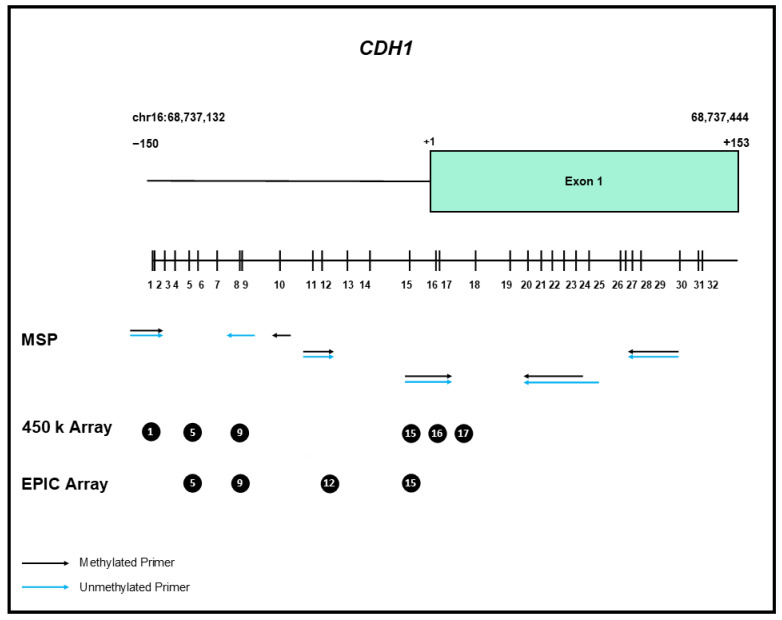
Figure 2.
Schematic overview of the CpG islands encompassing the 5′ end of the CDH1 gene. The individual CpG dinucleotides are represented by vertical bars, representing the distribution within the genomic sequence surrounding the start point of transcription (+1). The position of the primers for various MSP and qMSP assays are indicated by arrows, the CpG dinucleotides represented on the 450 k and EPIC array are indicated by circles.

