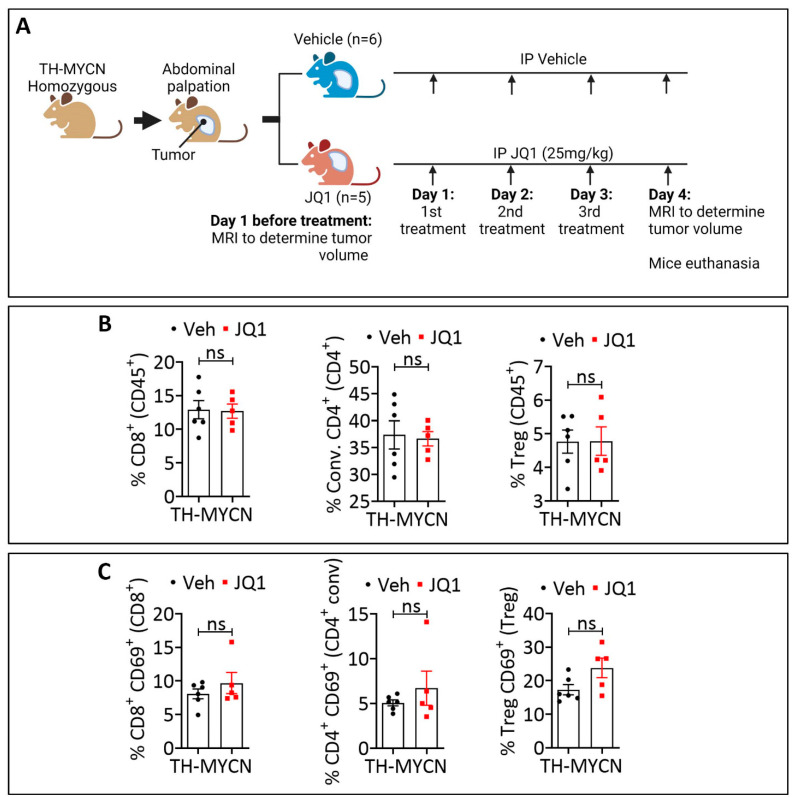
Figure 3.
Immune phenotyping of JQ1-treated TH-MYCN tumors. (A) Experimental design of JQ1 treatment of TH-MYCN tumor-bearing mice showing the schedule and dosing. Following the development of homozygote TH-MYCN tumors, the tumor volume was assessed by MRI in all mice. Mice were randomly assigned to a vehicle-treated group (n = 6) or a JQ1-treated group (n = 5). Mice were treated three times with vehicle or JQ1 (25 mg/kg) by IP on days 1, 2, and 3. On day 4 post-treatment, MRI was performed to determine the tumor volume, and tumors were harvested for immune phenotyping experiments. (B–D) Flow cytometry quantification of total (B), CD69+ (C), or PD-1+ (D) CD8+ T cells, conventional (Conv.) CD4+ T cells and Tregs infiltrating vehicle-treated or JQ-1-treated TH-MYCN tumors at day 4. The defined subpopulations were gated and quantified in live CD45+ cells. Each dot represents one tumor. The data are reported as the average of six or five mice per group. Results are shown as mean ± SEM (error bars). Statistically significant differences (indicated by asterisks) are calculated compared to vehicle-treated tumors using an unpaired two-tailed Student’s t-test (ns: not significant *: p < 0.05).


