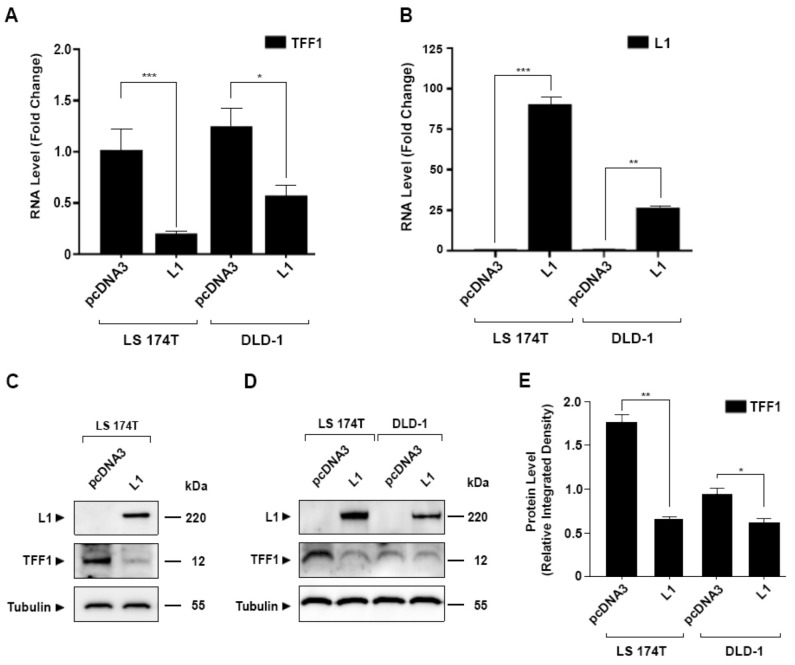
Figure 1.
Suppression of TFF1 expression in CRC cells overexpressing L1. (A) The level of TFF1 RNA was determined in L1 overexpressing LS 174T and DLD-1 CRC cells; (B) L1 RNA levels were determined by RT-PCR in the cells described in (A); (C,D) the expression of TFF1 and L1 protein was determined by Western blotting in the cell lines described in (A). Tubulin served as loading control; (E) the intensity of the TFF1 bands shown in the Western blots of the different CRC cell lines (D) was determined by densitometric analysis of the gels shown in (D). Relative integrated band densities of TFF1 were calculated from triplicate gels, and the significance was determined using Student’s unpaired t-test. * p < 0.05, ** p < 0.01, *** p < 0.001. The uncropped blots are shown in Supplementary File S1.

