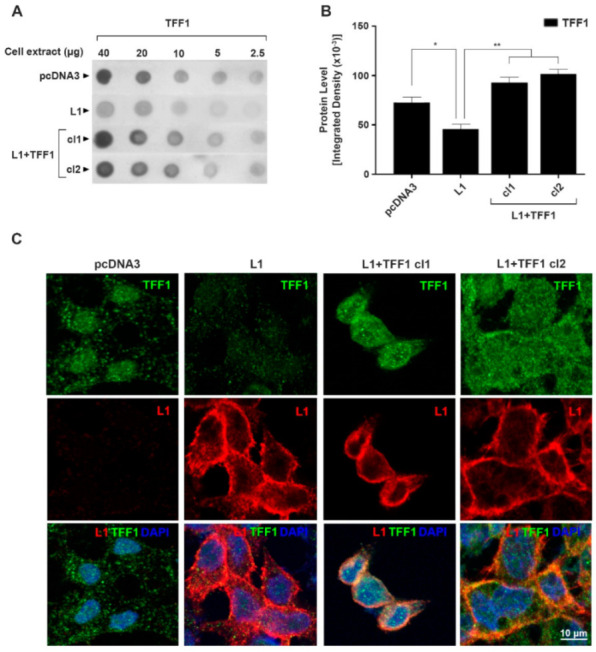
Figure 2.

Isolation and localization of L1 and TFF1 in CRC cell clones overexpressing both L1 and TFF1. (A) Serial dilutions of cell extracts analyzed by immuno-dot-blotting using LS 174T CRC cell clones overexpressing both L1 (L1) and TFF1 (L1 + TFF1 cl1 and cl2); (B) densitometric analysis of the dot blots shown in (A); (C) localization of L1 and TFF1 in CRC cell clones overexpressing both L1 (red) and TFF1 (green) by double immunofluorescence microscopy. Nuclei were stained with DAPI (blue). * p < 0.05, ** p < 0.01. The uncropped blots are shown in Supplementary File S1.
