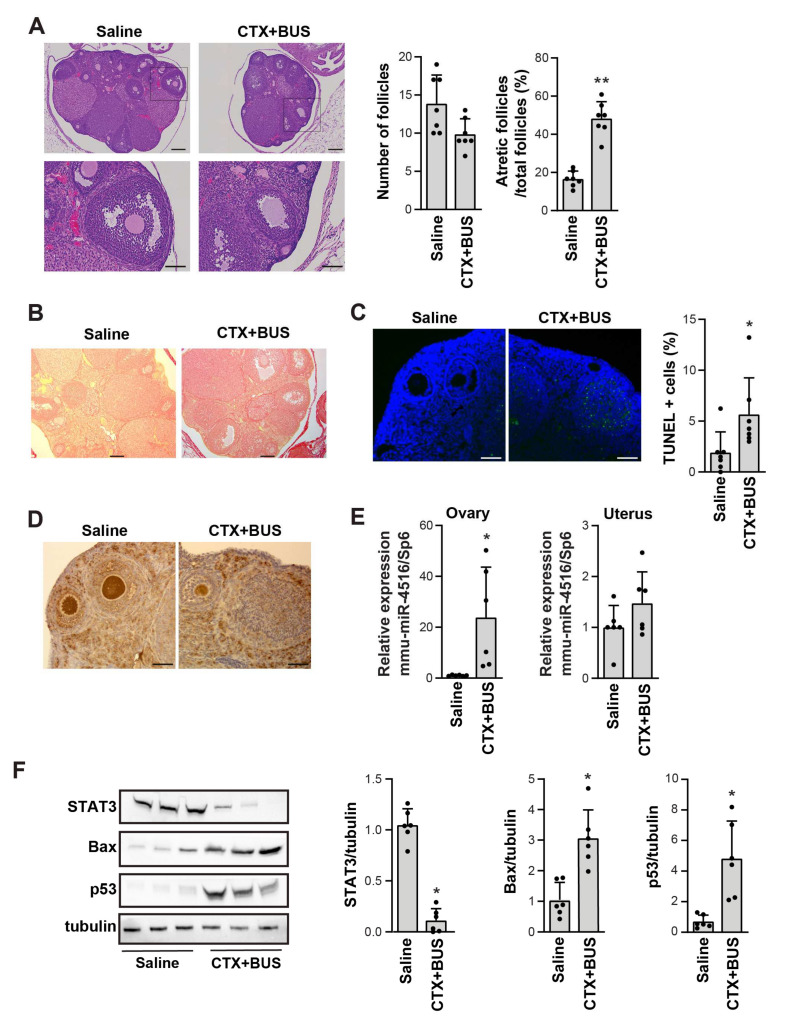
Figure 4.
Increase in miR-4516 expression in a chemotherapy-induced premature ovarian insufficiency (POI) mouse model. (A) Representative hematoxylin-and-eosin-stained images of the ovaries from saline- and CTX+BUS-treated mice (n = 7). Scale bar = 200 μm in the upper panel and 80 μm in the lower panel. (B) Representative images of Sirius red staining in the ovaries from saline- and CTX+BUS-treated mice. Scale bar = 200 μm. (C) Representative images of the TUNEL assay in the ovaries from saline- and CTX+BUS-treated mice. Scale bar = 80 μm. TUNEL-positive cells were counted by using ImageJ software (n = 7). (D) Representative immunohistochemistry images of Ki67 expression in the ovaries from saline- and CTX+BUS-treated mice. Scale bar = 80 μm. (E) Relative expression of mmu-miR-4516 in the ovaries and uteri from the saline- and CTX+BUS-treated mice were analyzed by using qRT-PCR. Relative miRNA expression was normalized by using UniSp6 as an internal control (n = 6). (F) Western blot analysis of STAT3, Bax, and p53 expression in the ovaries of saline- and CTX+BUS-treated mice. The relative protein level in (F) was normalized to tubulin levels (mean ± SD; n = 6). Asterisks (*, **) indicate significant differences (p < 0.05, p < 0.01, respectively) when compared to saline-injected mice.

