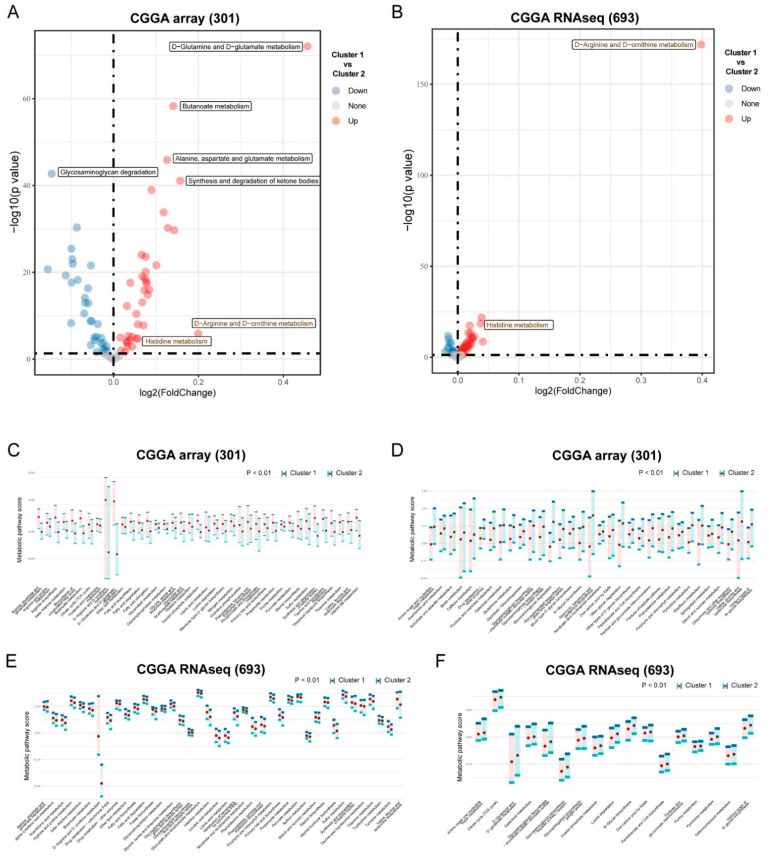
Figure 2.
Differentially active metabolic pathway between subtypes. (A,B) Volcano plot for differentially active metabolic pathway between cluster 1 and cluster 2 in CGGA array (301) and CGGA RNAseq (693) cohorts according to fold-change method. Red points mean the pathways that upregulated in cluster 1 compared with cluster 2, and blue points mean downregulation. Number of differential up- and down-regulated pathways in (A) is 38 and 32, respectively; number of differentials up- and down-regulated pathways in (B) is 36 and 16, respectively. (C–F) Distribution of pathway enrichment score between two clusters in CGGA array (301) and CGGA RNAseq (693) cohorts, one-sided Wilcoxon rank-sum test was used to evaluate the difference.

