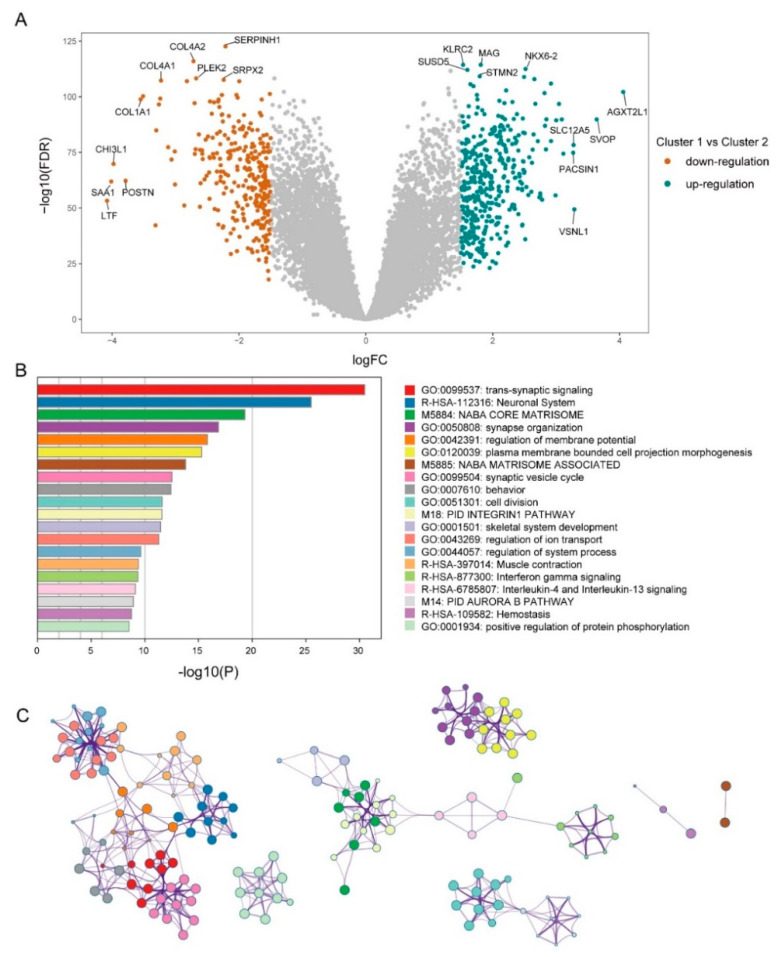
Figure 4.
Functional analysis for DEGs. (A,B) Heatmap shows DEGs between two clusters. Red points mean upregulated in cluster 1, turquoise points mean downregulation. (B) An analysis of pathway and process enrichment was conducted using the following ontologies: KEGG Pathway, GO Biological Processes, Reactome Gene Sets, Canonical Pathways, CORUM, TRRUST, DisGeNET, PaGenBase, Transcription Factor Targets, and COVID-19. Based on the graphical representation, the top 20 enrichments with p < 0.01 were displayed. (C) Edges connect terms that have a similarity > 0.3.

