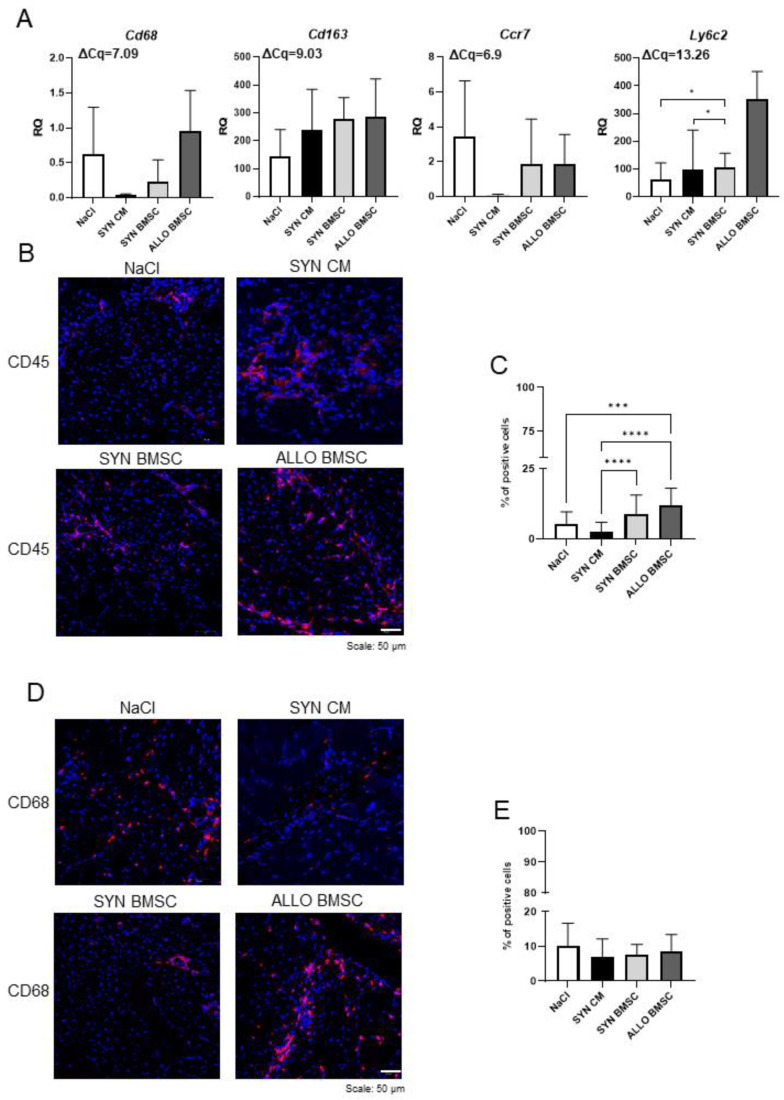
Figure 4.
Analysis of immune cell infiltration in regenerating muscles injected with NaCl or SYN CM or SYN or ALLO BMSCs. (A) Expression of immune cell markers: Cd68, Cd163, Ccr7, and Ly6c2. Hprt was used as a reference gene. RQ = 1 for the level of gene expression detected in 13.5-day-old mouse embryo (used as reference sample). Average ΔCq for the reference sample is shown in each graph. Data are presented as means of three independent experiments with standard deviations. (B) Representative images of CD45 immunostaining in the muscles analyzed 14 days after injury. Analyzed proteins are shown in red; DNA in blue. Scale bar: 50 µm. (C) Proportion of CD45 positive cells to all cells counted in sections of analyzed muscles 14 days after injury. For all variants n ≥ 20. (D) Representative images of CD68 immunostaining in the muscles analyzed 14 days after injury. Analyzed proteins are shown in red; DNA is shown in blue. Scale bar: 50 µm. (E) Proportion of CD68-positive cells to all cells counted in analyzed muscle sections 14 days after injury. For all variants n ≥ 20. Data found to be statistically significant are underlined on graphs and are marked with asterisks (* p < 0.05; *** p < 0.001; **** p < 0.0001).

